Insights & Updates
Latest from Tattle
Discover trends, tips, and insights to elevate your restaurant operations.
Discover trends, tips, and insights to elevate your restaurant operations.


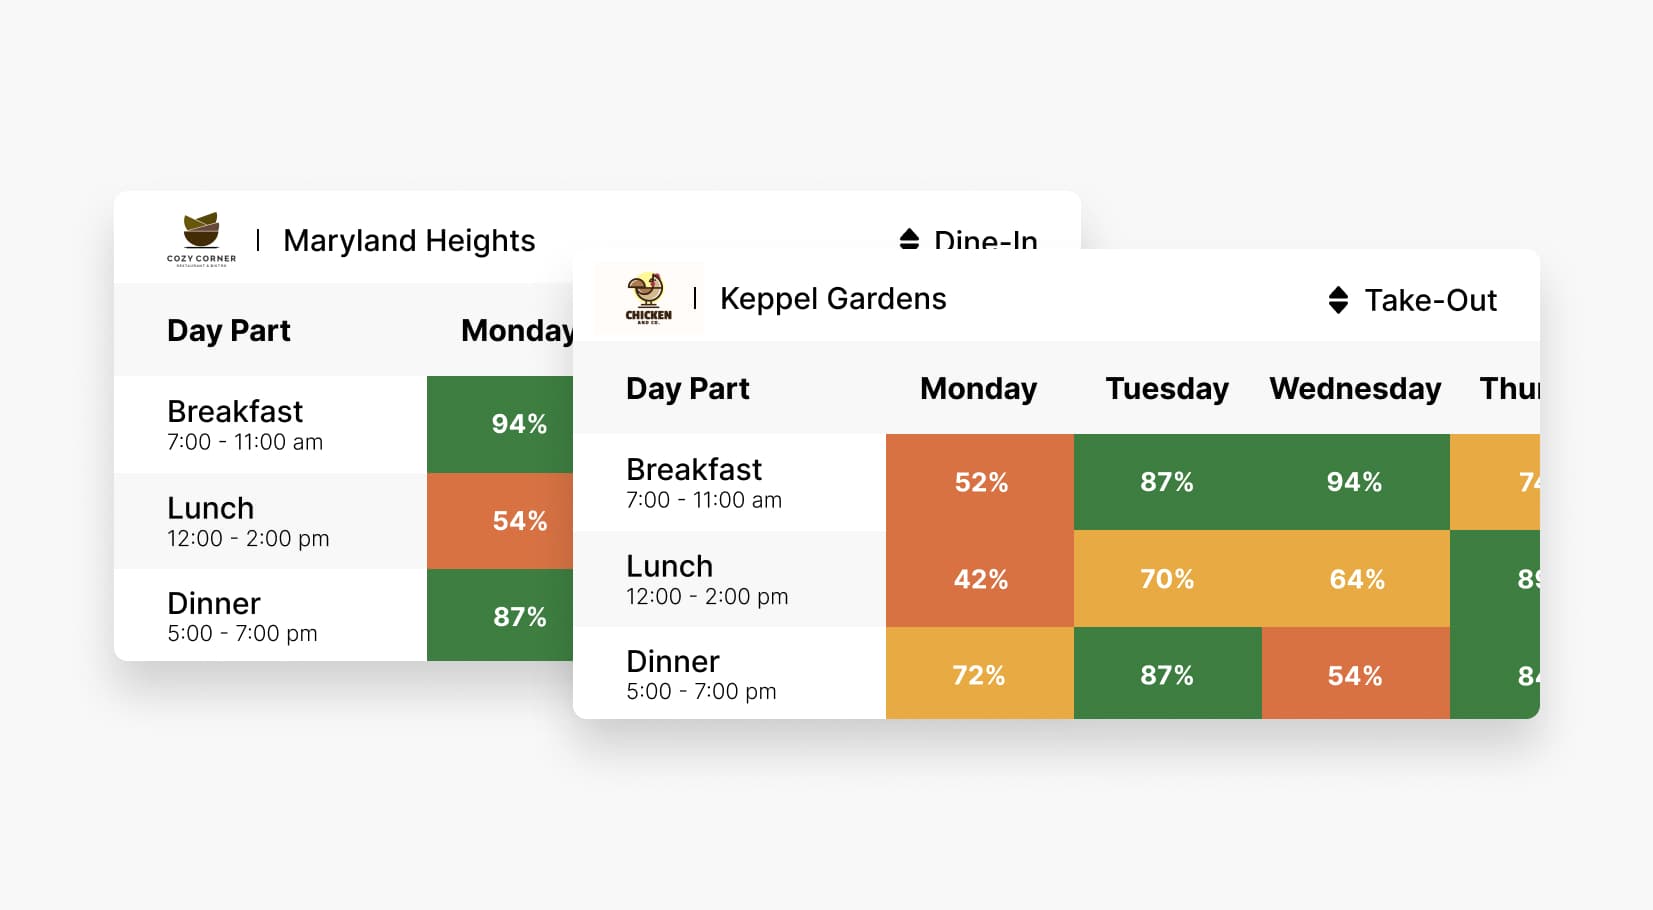
Sales and traffic vary by time of day for a restaurant. Thus, so should your allocation of resources.
Daypart analysis divides the day into distinct segments – such as breakfast, lunch, dinner, and late-night – to understand how guest preferences vary across these periods. This is a key indicator of how optimized your resources (e.g. labor), operating processes, and capacities are to meet the demands of each time of the day.
This is crucial for understanding your customer behavior patterns throughout the day and organizing your strategies around them. The following are some of the most common ways restaurants analyze dayparts:
Now, there’s a reason I’ve listed satisfaction trends as the first item on the list. It’s the foundational daypart analysis you have to perform before anything else. This is because satisfaction metrics are the precursors to everything else: it will predictably lead to higher sales, and help you identify any gaps in staffing, menu recipes, and operational procedures.
In this article, I’ll show you how to perform a comprehensive satisfaction daypart analysis, and how to zoom in on individual operational areas using this handy chart.
Here’s an example of a real satisfaction daypart heatmap I’ve put together for one of Tattle’s partners.
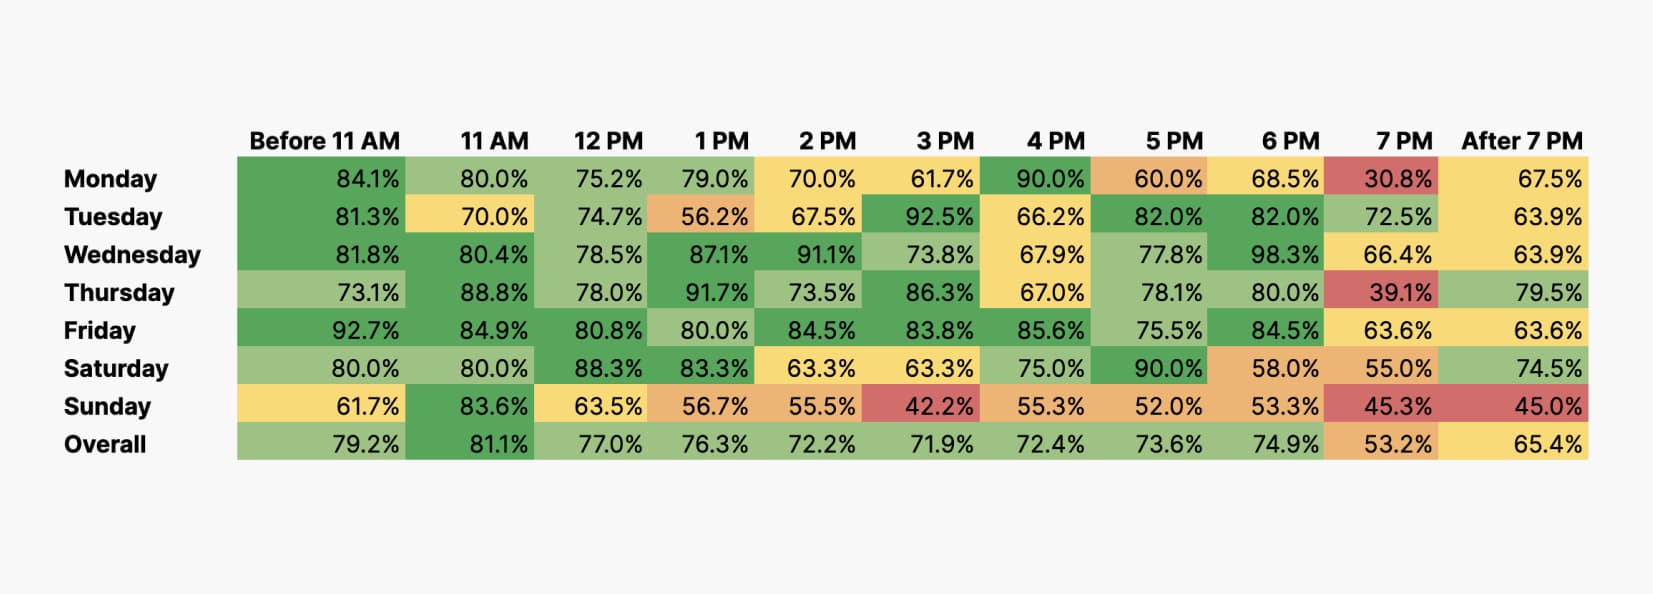
The horizontal axis is broken down by time of day. In this example, a day is divided into time periods that are one hour apart, from before 11am to after 7pm. But some restaurants also use their own defined dayparts such as breakfast, lunch, happy hour, dinner, late-night etc.
The vertical axis shows different days of the week when you’re open for business, as well as the last row “overall”, which shows the average of the week regardless of day.
In each cell, you have the satisfaction metric. At Tattle, we use Customer Experience Rating (CER), which is the level of a guest’s overall satisfaction on a 1-100% scale.
This heat map allows you to immediately spot your problem areas (yellow, orange, red colored cells). Based on the color clusters, you can tell that guest experience in the later dayparts tend to suffer more than that before 6pm, and Sunday is the worst-performing day of all. Those are the time periods to focus your attention and investigation on.
The reason why certain dayparts are underperforming and the way to investigate that differs from restaurant to restaurant. However, some common questions to ask in your investigative process include:
One side note: I actually rarely see restaurants be flexible with the labor structure depending on the traffic volume. Most stick to the same allocation regardless of daypart, and that could lead to a discounted guest experience. If you can tailor your labor deployment based on a quick daypart analysis like this, you’re already a huge step ahead of the competition.
The overall satisfaction metric only gives us a bird’s-eye view of where to focus on. But how do we know exactly what’s contributing to a high or low satisfaction in a particular daypart?
The three most common operational areas that tend to suffer as a result of misallocation of resources during different dayparts are accuracy, speed and hospitality. And these also tend to be the leading causes of low guest satisfaction.
But how do you isolate the main cause out of these three areas (or even more)?
Here’s the advanced tip I want to share with you: you can layer in a specific operational area’s satisfaction metric onto your daypart heatmap, to see how much it’s affecting each daypart’s performance.
Let me give you an example.
Using the same daypart heatmap we obtained previously, now we can layer in guest satisfaction in accuracy. This data is obtained using Tattle’s causation-based surveys, which collect guest satisfaction scores in each operational area, including accuracy, speed, hospitality, food quality and more.
If we add a row and column of accuracy satisfaction, we obtain the new heatmap below.
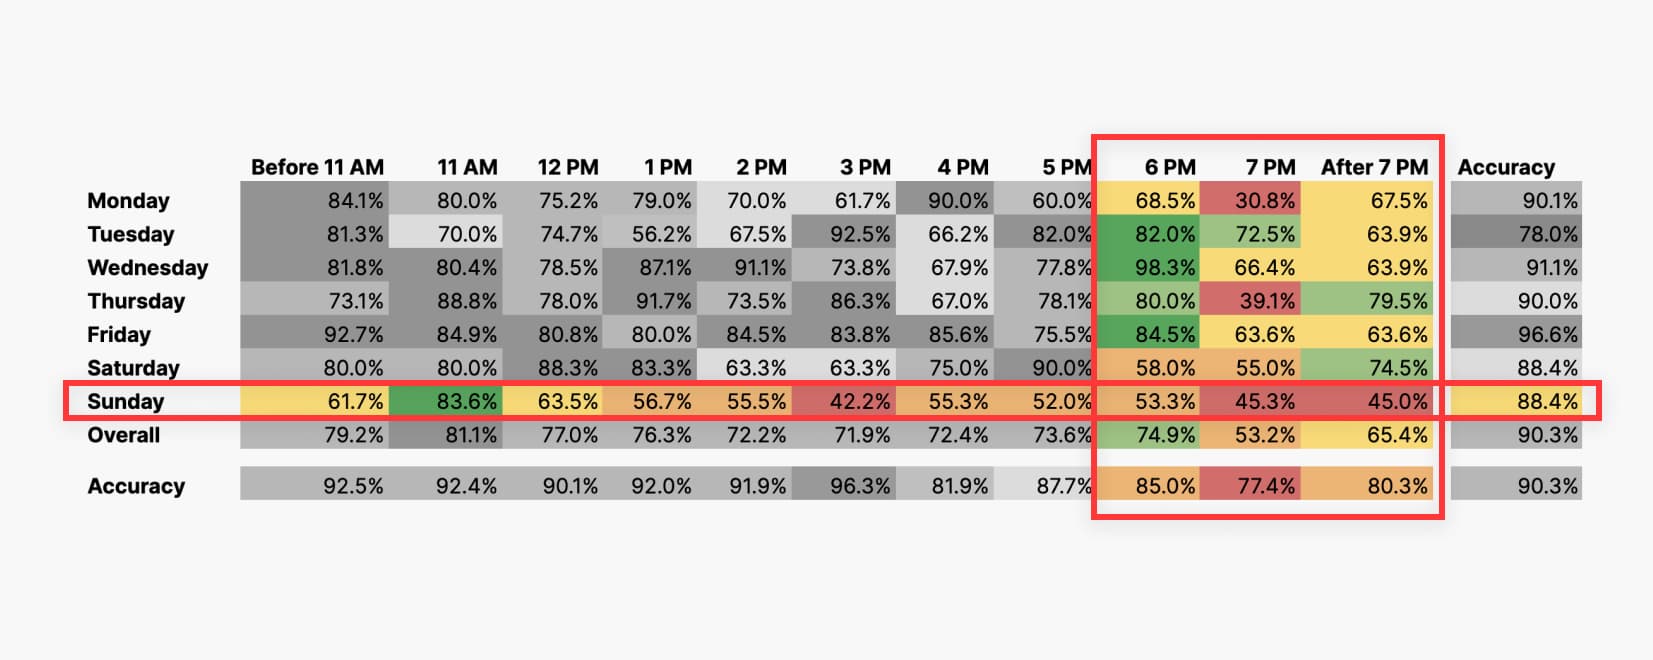
As you can see, accuracy is highly correlated with overall satisfaction, especially in the low-performing dayparts. From 6pm onwards, both overall satisfaction and accuracy satisfaction suffer. On Sunday, accuracy is also relatively subpar compared to the other days of the week.
Therefore we can conclude that in this case, accuracy is highly likely to be impacting the overall guest experience. This is very common, accuracy tends to suffer when a unit is understaffed, or if the team members aren’t comfortable with preparing a certain menu item (e.g. new LTOs or a change in recipe). That’s also why accuracy is typically a key measure of your operational execution.
Just exactly how big could this impact be?
Let’s say your percentage of inaccurate orders is 40%, and your total transaction count per year is 100k. Your estimated number of inaccurate orders would be 40% x 100k = 40k orders. Given an average check size of $30, that’s $1.2M gross sales tied to inaccurate orders!
That means you have $1.2M tied to guests who realize there’s something wrong with their order and indicate a negative experience — and are at risk of not coming back again.
That should be compelling enough reason for you to zoom in onto dayparts affected by order inaccuracy ASAP.
Speed of service is another common operational area that tends to suffer when transaction counts grow but restaurants are understaffed during certain dayparts.
Speed is also a proxy measure of food quality, as food quality is typically a result of accuracy and speed. Guests tend to perceive a product as high quality if it’s executed right and quickly. Speed is also an indicator of how likely your food will suffer from temperature degradation. This is especially true for off-premise orders, as slower service could mean longer travel and wait time for the food, and higher likelihood of the food getting cold.
Similar to the accuracy analysis above, you can layer in satisfaction metrics for speed, which measures guests’ perceived speed of service as part of their experience.
When traffic is high but your team members are stressed or overwhelmed, hospitality tends to suffer. They might forget to greet or bid farewell to the customers, or smile and maintain eye contact.
If your restaurants boast great hospitality as a key pillar of your brand identity, make sure to look into how hospitality satisfaction is impacting the overall satisfaction of each daypart, and use that to estimate whether your teams are stressed out during certain hours of the day.
There you have it — the right way to perform daypart analysis using the powerful, yet simple, heatmap chart. And of course, everything starts with having statistically significant and accurate data directly from your customers. That’s where Tattle comes in.
Having worked with top brands including Dunkin’ and Blaze Pizza, I have seen first-hand how Tattle is the only CX platform that collects high-velocity, accurate, actionable and statistically reliable guest feedback data for restaurant executives to base key decisions on.
If you’re curious, check out the interactive demo of the platform below or check out a rapid demo of the platform (https://get.tattleapp.com/request-demo/)!
About the Author
Intelligence & Analytics Expert
Alex formerly led Customer Excellence programs at Blaze Pizza and Dunkin'. Now, he oversees LTO testing, operational analysis, and ROI optimization for Tattle partners.