Insights & Updates
Latest from Tattle
Discover trends, tips, and insights to elevate your restaurant operations.
Discover trends, tips, and insights to elevate your restaurant operations.


Once you start to manage more than 10 restaurant locations, it will soon become challenging to keep up with everything that goes on at each location.
That’s when an effective data visualization chart can really become a time (and life!) saver.
In this article, I’ll show you the single most effective graph for answering, at a glance, the following key questions when you oversee multiple restaurants:
Wow! That’s a lot of insights represented inside a single chart!
That’s right. This is a chart that I developed for real Tattle partners ranging from 10 to thousands of locations, to help the executives and regional managers visualize their brand and store-level performance quarter over quarter.
Now you can apply the same chart to your restaurant operations too.
There are two key measures of how well your brand is performing in terms of guest experience: overall guest satisfaction and consistency.
(And yes, guest experience and its key metric — guest satisfaction, is the single most important indicator of your restaurants’ performance.
Now let’s take a look at the Location Performance Spread chart, which encompasses both these two key measures within one graph.
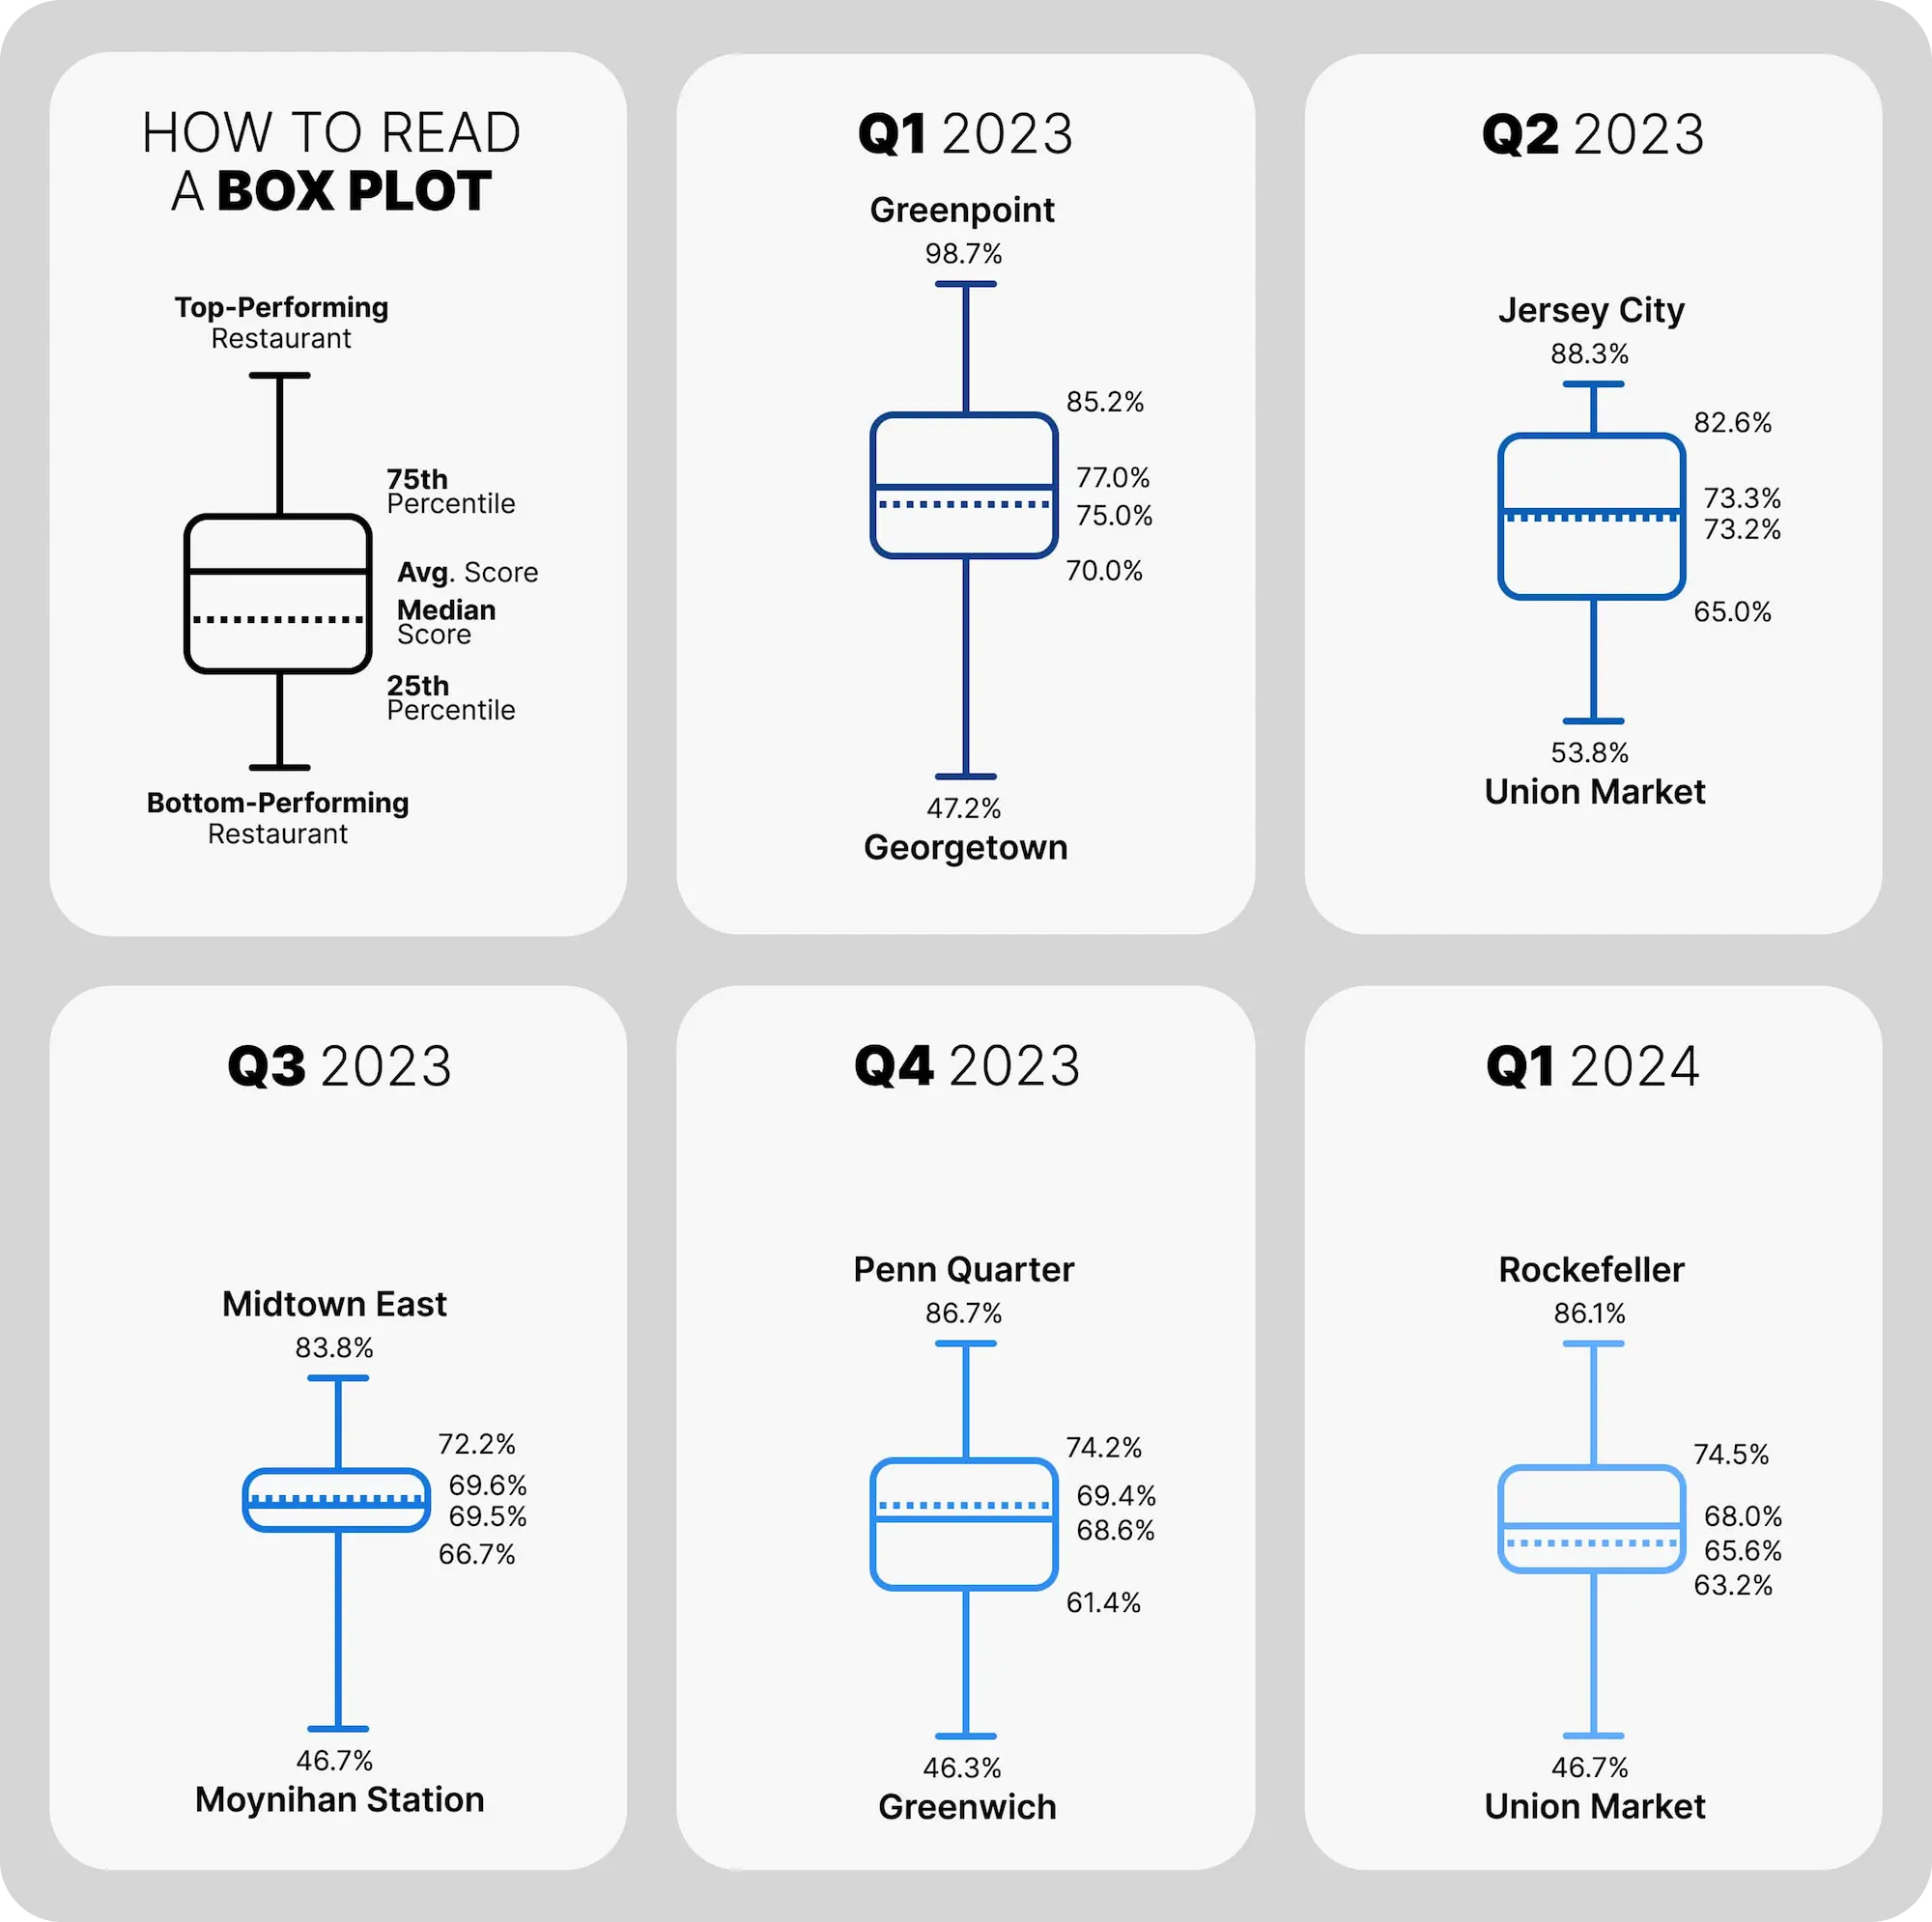
In this box plot, you get a spread of all your locations’ performances for each quarter (you can use different time frames like month, year, etc.). This allows you to see any changes over time. Performance is measured using Tattle’s CER (Customer Experience Rating) score, but you can use other satisfaction metrics like NSAT, Top Box etc.
The top and bottom of the axis represents your highest-performing and lowest-performing locations respectively, and the top and bottom of the box represent the 75th and 25th percentile. The dotted line in the box represents the median score, while the solid line the average score.
Now, here comes the fun part.
Overall satisfaction is represented by the level of your median score, which brings the entire box up and down. A higher box means your brand on average delivers a highly satisfying guest experience, and vice versa. For example, in this example, in Q1 2023 this brand (based on an actual Tattle partner) saw the highest satisfaction, which subsequently declined over time.
On the other hand, consistency is represented by the spread, aka how wide the box is. The tighter the box, the more consistent guest experience is across all your locations. As you can see in this chart, in Q3 2023, the brand had the most consistent performance across the board, despite having a lower overall satisfaction than the previous two quarters.
Based on this chart, you can place your brand into one of the following 4 cells:
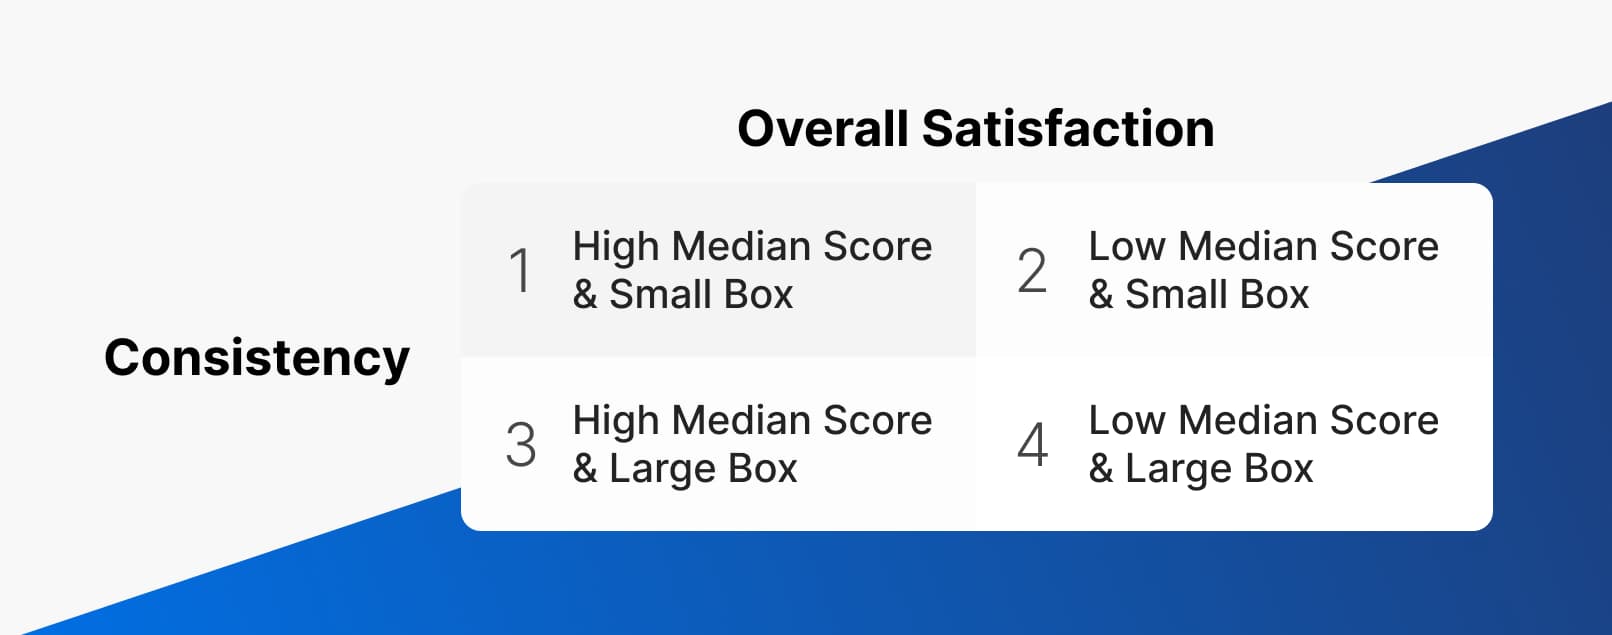
Obviously you’d want to achieve cell #1, where you’re a consistently high-performing brand. And it’s a no brainer to avoid cell #4, where your guest experience is subpar and all the locations are all over the place in terms of executing against brand standards.
Now the question become, do you prefer cell #2 or cell #3?
No matter how well-defined your brand standards are and how well you’re measuring your brand experience critical control points, inconsistency will always naturally occur between different restaurants, as no two restaurants are exactly the same.
As a rule of thumb, you want to bring your brand-level overall satisfaction (aka the median score) up first by establishing brand standards, menus and processes that meet the expectations of your guests. From there, you can zoom in onto specific location performance to minimize the experiential gap.
Ideally, you want to be in cell #3, if not cell #1.
But how exactly can you improve on both overall satisfaction and consistency? Let’s dive deeper.
Whichever cell you’re currently in, the good news is that there are prescriptions for your current situation.
If you’re experiencing challenges in bringing up your overall satisfaction, examine the brand-wide systems you’re giving to the location-level teams: Are you providing the right standards and executions for your teams? Are they provided with the best training possible to execute against the brand standards? The better you are at providing strong, solid systems, the more likely your locations can hit brand standards and your overall satisfaction will improve.
If you struggle with closing experiential gaps between locations, that would require a more targeted approach. Are there best practices that your high-performers are using that your low-performers are missing? Can you simplify your operations to make sure the lower-performing restaurants can hit the brand standards more often? Do you need to provide extra training and coaching? Can you organize contests or staff spotlight programs to incentivize lower-performing locations?
The great thing about this chart is that you can visually see whether your efforts are paying off over time, as you observe the position and spread of the boxes quarter by quarter.
Hopefully now you have another tool in your tool belt for managing your restaurant locations. If you’re interested in learning more about how we help 11,000+ restaurants improve their brand experience, feel free to reach out to our team here.
About the Author
Intelligence & Analytics Expert
Alex formerly led Customer Excellence programs at Blaze Pizza and Dunkin'. Now, he oversees LTO testing, operational analysis, and ROI optimization for Tattle partners.