Insights & Updates
Latest from Tattle
Discover trends, tips, and insights to elevate your restaurant operations.
Discover trends, tips, and insights to elevate your restaurant operations.

After working with tens of thousands of restaurants over the last decade, we have seen firsthand how most restaurant brands either use text analytics improperly or rely on them far too heavily.
We’re going to quickly break down what Text Analytics are, the problems we have identified, niche scenarios to use them, and a better customer experience methodolgy altogether.
Text analytics is a method used in the restaurant and hospitality industry to evaluate guest feedback. These analytics utilize complex algorithms to process large amounts of unstructured text data, such as customer reviews and comments.
The goal is to extract insights and identify patterns in the guest experience, ultimately trying to help operators and executives make data-driven decisions that improve sentiment.
While Text Analytics sounds like a great option for brands looking to sift through copious text data, it rarely produces the desired results in isolation. Here are four problems with this methodology that virtually eliminates its use as a primary or secondary restaurant data visualization.
This is the biggest offender. Much of our ordinary language is invalidated by the algorithms behind Text Analytics — a single word, phrase, or sentence can mean different things in different contexts.
Contextual words, homonyms, synonyms, irony, sarcasm, ambiguity, typos, colloquialism, slang, low-resource languages, etc. could all result in misunderstandings and inaccurate findings that don’t properly correlate with guest satisfaction and revenue.
For example, when creating a word cloud, the reviews “The fries were great” and “The fries were not great” are equally ranked. Two “fries”. Two “great”. Unfortunately, the word cloud has no clue that their context is completely reversed in meaning, yet regards them as the same.
Text Analytics are highly prone to misinterpretation, especially when restaurant brands read too far into the data and try to pull something away of value.
Not only can Text Analytics be a hassle to integrate with other platforms and services – such as review sites, social media accounts, website forms, and email responses – but none of these channels were built with Text Analytics in mind. Trying to automate and mine these various sources is labor-intensive and painful.
If you thought the integration process between all these unoptimized channels wasn’t simple, the execution of Text Analytics is even less so.
When bodies of text are evaluated, complex processes are at play – such as tokenization, parts-of-speech tagging, parsing, lemmatization, stemming, stopword removal, text normalization, and lowercasing.
Ultimately, launching and maintaining Text Analytics takes a great deal of time, labor, and data to execute properly. Even so, because of the complex, varied nature of the data sourcing and the data manipulation, it isn’t difficult for the results to be error-prone.
The broader the scope of your Text Analytics, the more chaotic the results will be. This happens all the time when restaurants compile a half dozen sources of customer reviews, comments, feedback, emails, and call transcripts into a cauldron of a word cloud.
The nuance and granularity of operations is completely lost — and so too is the actionability.
For example, without being organized into different categories and channels, you’ll have a hard time understanding whether the complaint of “slow” appears more in the dine-In, pick-up, or delivery channel.
Another example, how can action be taken on the word “temperature” and its derivatives if you can’t identify the menu item(s) associated with the temperature complaints?
There are countless more examples like these within every restaurant brand’s operations.
First, Text Analytics should never be a primary visualization of customer feedback and sentiment. Only when it is highly contained can it lead to results not privy to misinterpretation – and usually that comes after a deep evaluation of the top-tier metrics.
Second, Text Analytics should be used almost exclusively by brand leadership and executives.
This ensures a maximum sample size across the entire lot of restaurants, ensuring the algorithms can actually chew up enough data to spit out viable results.
Regional managers, general managers, and franchisees should really never see a word cloud of any sort regarding their restaurant. There isn’t enough data and categorization to provide helpful insights.
Now, here’s an example of how you can use Text Analytics effectively:
When evaluating the performance of a Limited-Time Offering (LTO), you’ll want to survey customers that didn’t order the LTO and ask them why they chose something else.
You can provide a dropdown of answers like “Already knew my order” or “Wasn’t aware” or “Concept not appealing”. The last dropdown might be “Other”, which would have a conditional text box open up for them to provide details as to why they didn’t choose the LTO. From there, you can use Text Analytics to quickly find patterns in their responses.
To illustrate further, you might see a lot of “Vegan” or Gluten-Free” word variants crop up. Then you’ll know that you may want to consider adding some additional dietary options.
(By the way, here’s a really handy LTO playbook that you can grab for free).
Text Analytics – especially in the form of word clouds – tend to misdirect teams to focus on terms that appear the most number of times, rather than terms that most correlate to impact on satisfaction. A top-selling menu item might appear the most times in a word cloud, but doesn’t tell the team whether those experiences are positive or negative.
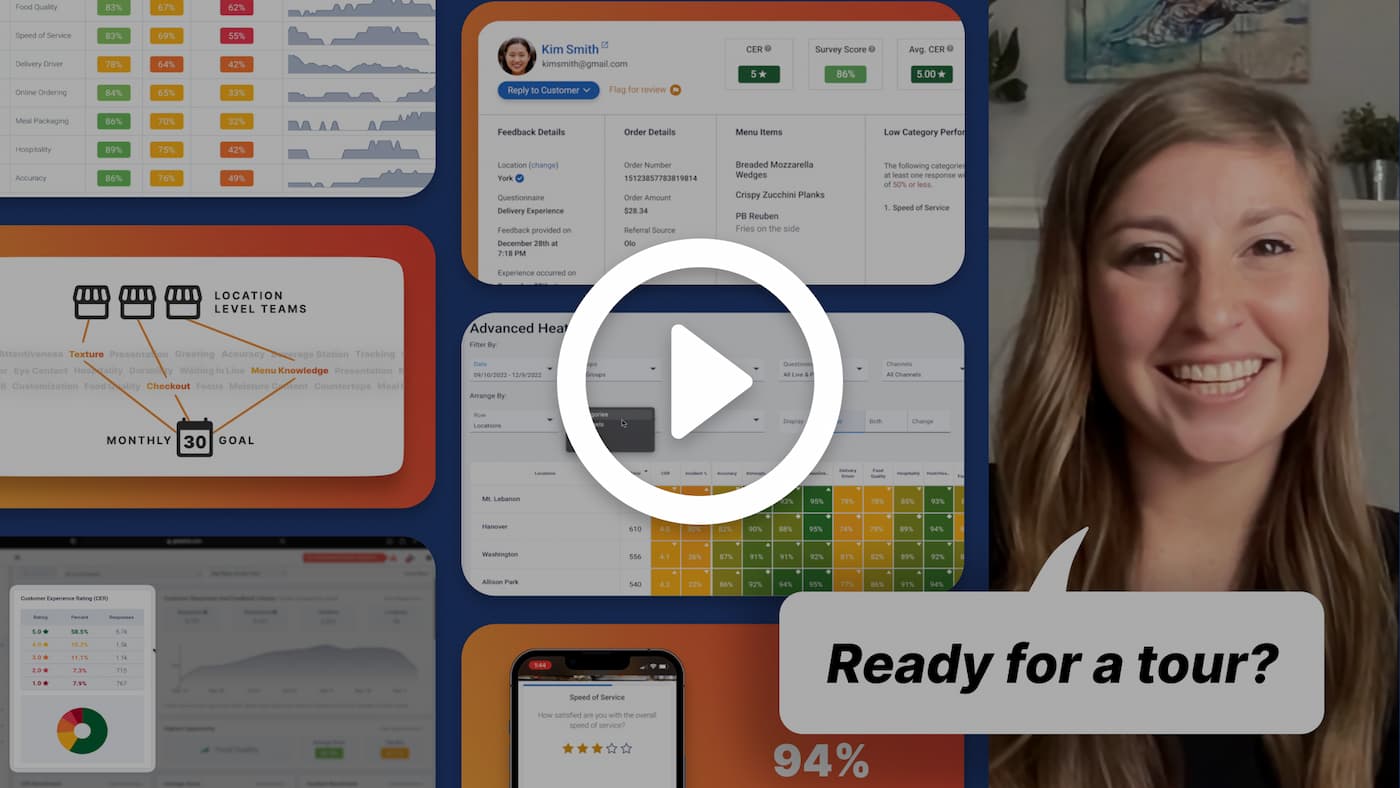
In order to have this direct correlation between the elements of a guest experience and the satisfaction of each part, this is what restaurant brands need: granular, organized, and actionable customer insights that are collected automatically, in real-time, and within a single platform. That’s what Tattle does for 200+ brands, such as Chili’s, Hooters, and MOD Pizza.
Unlike Text Analytics, Tattle surveys provide well-structured data, parsing guest feedback out into multiple categories, factors, and filters. Here’s what that looks like:
Categories: Food Quality, Order Accuracy, Speed of Service, Hospitality, etc.
Factors: Within the Food Quality category, you might track Temperature, Texture, Taste, Appearance, etc.
Filters: You might organize categories and factors by Location Group, Individual Location, Ordering Channel, Daypart, Menu Item, or more.
If you want to learn more about Tattle guest feedback platform, (https://get.tattleapp.com/landing-feedback/). Or, watch a rapid demo of the platform below!
Want more?