Insights & Updates
Latest from Tattle
Discover trends, tips, and insights to elevate your restaurant operations.
Discover trends, tips, and insights to elevate your restaurant operations.
We’re excited to announce the launch of Tattle’s new Industry Benchmarking Report, an exclusive data report that offers in-depth insights into restaurant brand’s performance across operational categories and ordering channels, benchmarked against industry verticals (etc. burgers, pizzas, fast casual etc.) or geographical regions. This restaurant benchmarking report is our attempt to resolve the inaccessibility of granular performance comparison beyond broad operational categories, and equip both the marketing and operations teams with detailed, actionable insights to target their highest opportunity for improvements and growth.
This report will be initially offered as an optional add-on presentation to Tattle partners (but will be extended to the hospitality industry in general), and is aimed to provide more context around their top growth opportunities identified in the Tattle dashboard by our AI/ML algorithms. Restaurant brands interested in this offering will receive a fully customized report on a quarterly basis, detailing how they compare in each operational category and transaction channel with their peers. All data within the report will be anonymized, and brands unwilling to participate can choose to opt out.
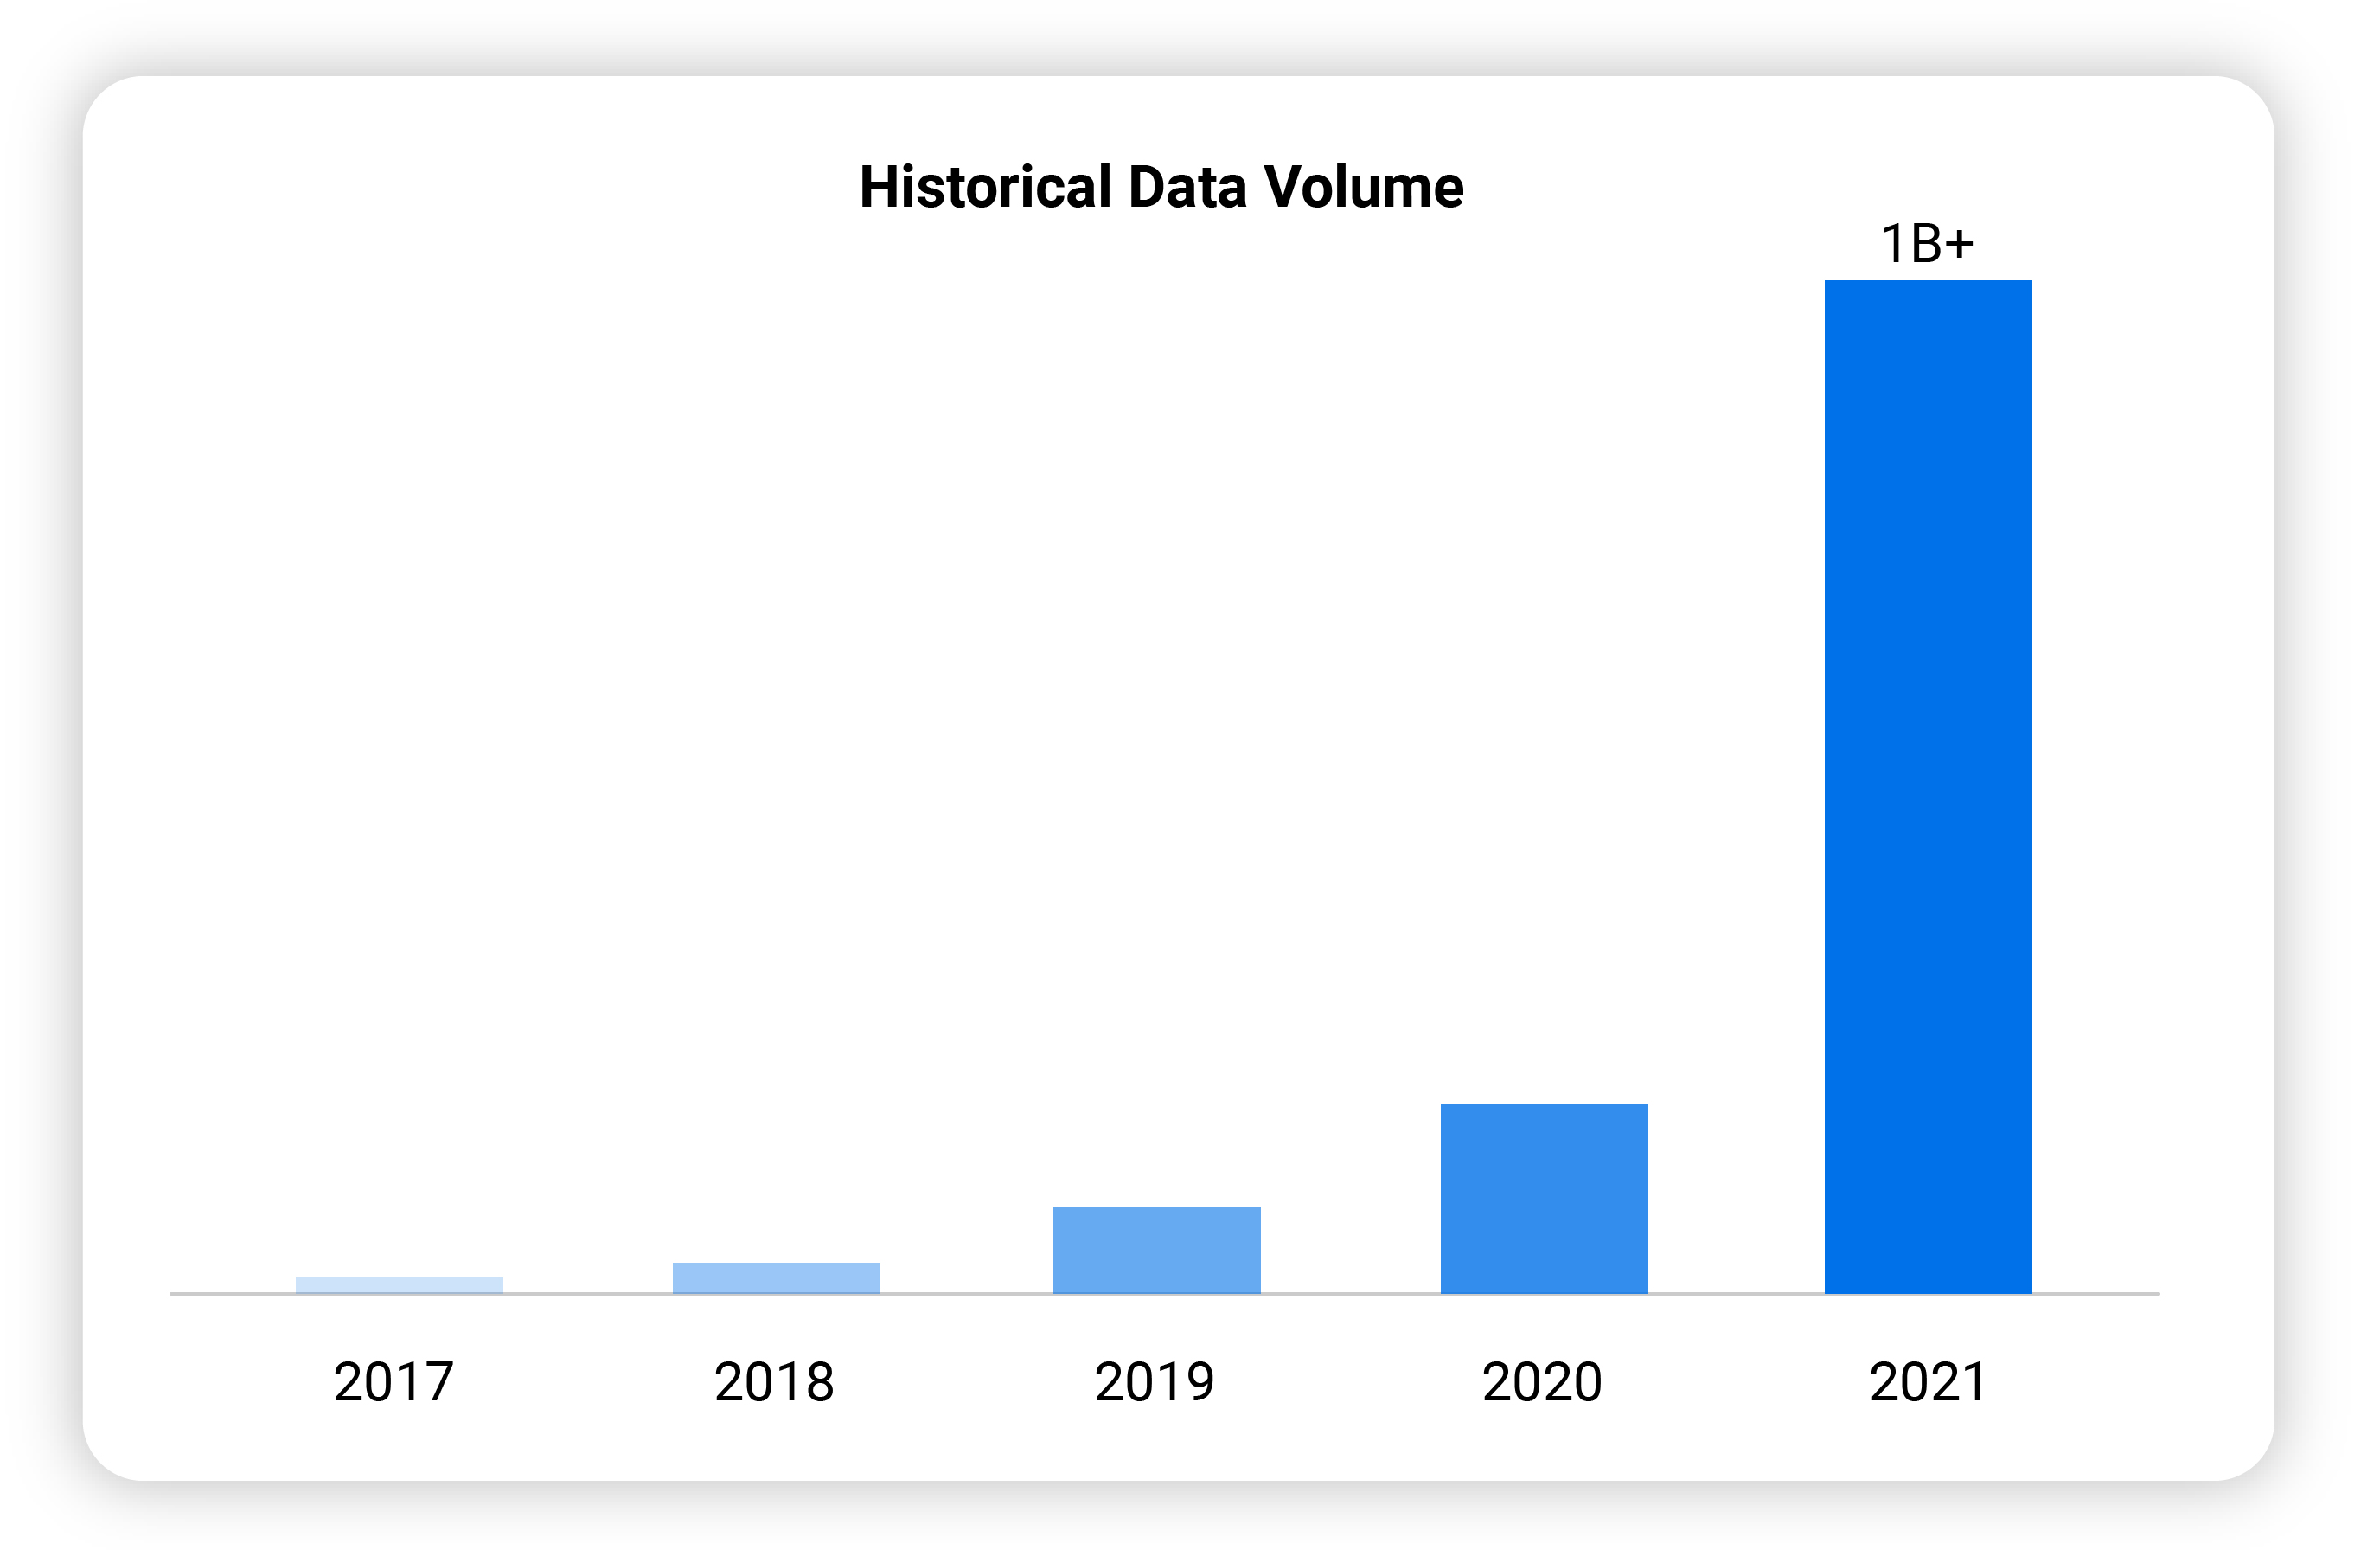
Since the inception of Tattle, data has always been central to the company. That’s why we are able to uncover insights that are more granular and more actionable for our brand partners than alternative solutions. This year, we’re extremely excited to have eclipsed 1.3 billion feedback data points collected, with a year-over-year increase in data point collection of 1,000% (up from previously 600%). This wouldn’t have been possible without having some of the most well-known brands in hospitality joining the Tattle community.
The fast growth in our primary data point collection not only improves the accuracy of our AI-driven recommendations, but also paints the picture of hospitality industry performances as a whole, as well as the performance of individual brand, vertical, geographical location and more. Over the past year, we’ve been working closely with many Tattle restaurant partners to figure out how to leverage our data to provide the most value to both our partners and the hospitality community. Those efforts have culminated in our upgraded restaurant benchmarking report today.
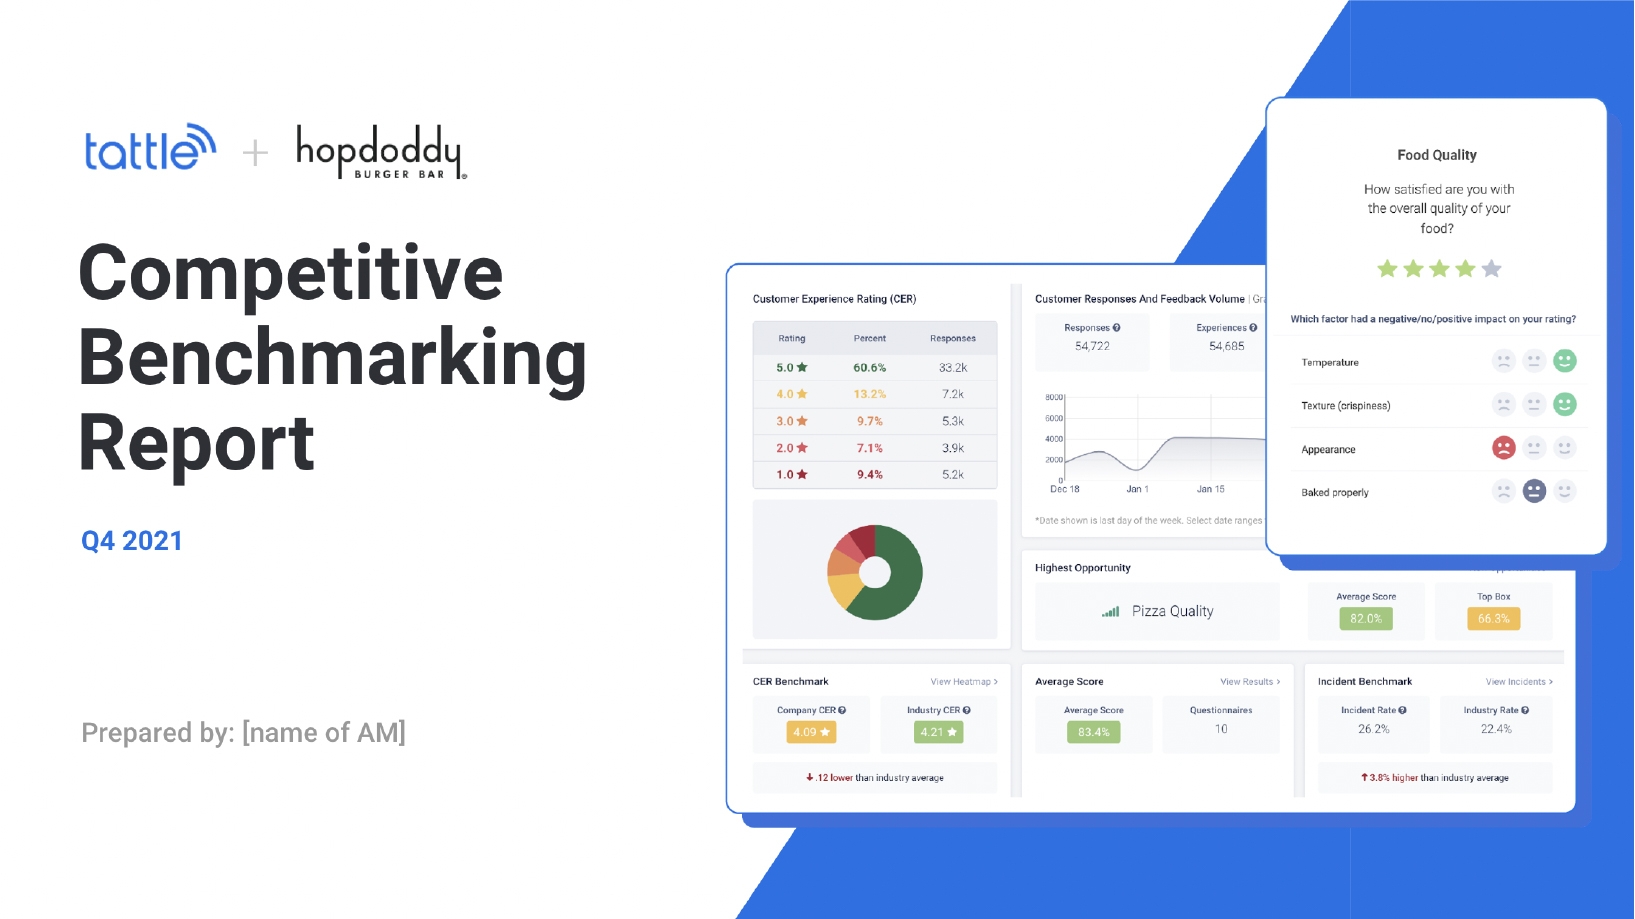
Here’s a brief breakdown of the key components of each report, which will be subject to change based on each brand partner’s priorities and verticals.
Our selection of the competitor set is based on the needs of each partner. There are multiple ways that Tattle could break down the competitors set:
The restaurant benchmarking report can also offer benchmarking for various competitor sets upon request, so each brand can understand their position within different competitor groups and understand their top growth opportunities.
Over the past few years we’ve seen a rapid (https://www.nrn.com/operations/three-secrets-leveraging-customer-feedback-drive-operational-improvement) (takeout and delivery), and an increased emphasis on off-premise guest experience by restaurant brands. When comparing the guest satisfaction across ordering channels (Dine-in, Takeout and Delivery), Our data shows that delivery orders have seen (https://www.nrn.com/operations/three-secrets-leveraging-customer-feedback-drive-operational-improvement) in average overall satisfaction since January 2021, dropping from 84% satisfaction down to 74% in March 2022.
There are more uncontrollable external factors when it comes to off-premise guest experience (delivery drivers, weather etc.), which makes it even more crucial for operations teams to excel in the areas they could control. With more and more ghost kitchens and virtual restaurants on the platform, Tattle is able to provide unique insights into the biggest opportunities for improvements across the industry, as well as for each brand partner.
The off-premise benchmarking section of the report will give an in-depth look at the top factors and operational categories that contribute to a positive or negative guest experience, such as order accuracy, food quality and speed of service, and offer recommendations on exactly what each restaurant brand can do to stand out from the competition.
For many brands, dine-in is still the bread and butter of the business. Our data has shown that dine-in tends to have the highest satisfaction around 95% even post COVID-19, compared to delivery (74%) and take-out (84%).
Similar to off-premise restaurant benchmarking, we'll offer a comprehensive analysis of top factors and operational categories that contribute to a positive or negative on-premise guest experience, and how the particular brand partner’s performance is compared to the others in the competitor set. For each top opportunity, we’ll also offer concrete, actionable recommendations on exactly how to improve in order to stand out from the crowd.
The restaurant benchmarking heatmap is a detailed breakdown of the Customer Experience Ratings for all of the brand’s competitors (anonymized) for each operational category, with the brand partner’s standing in the mix. This not only gives the brand a clear picture of where they stand in terms of the overall guest experience, but also marks out exactly which area has the most opportunity for improvement for the brand to rise to the top.
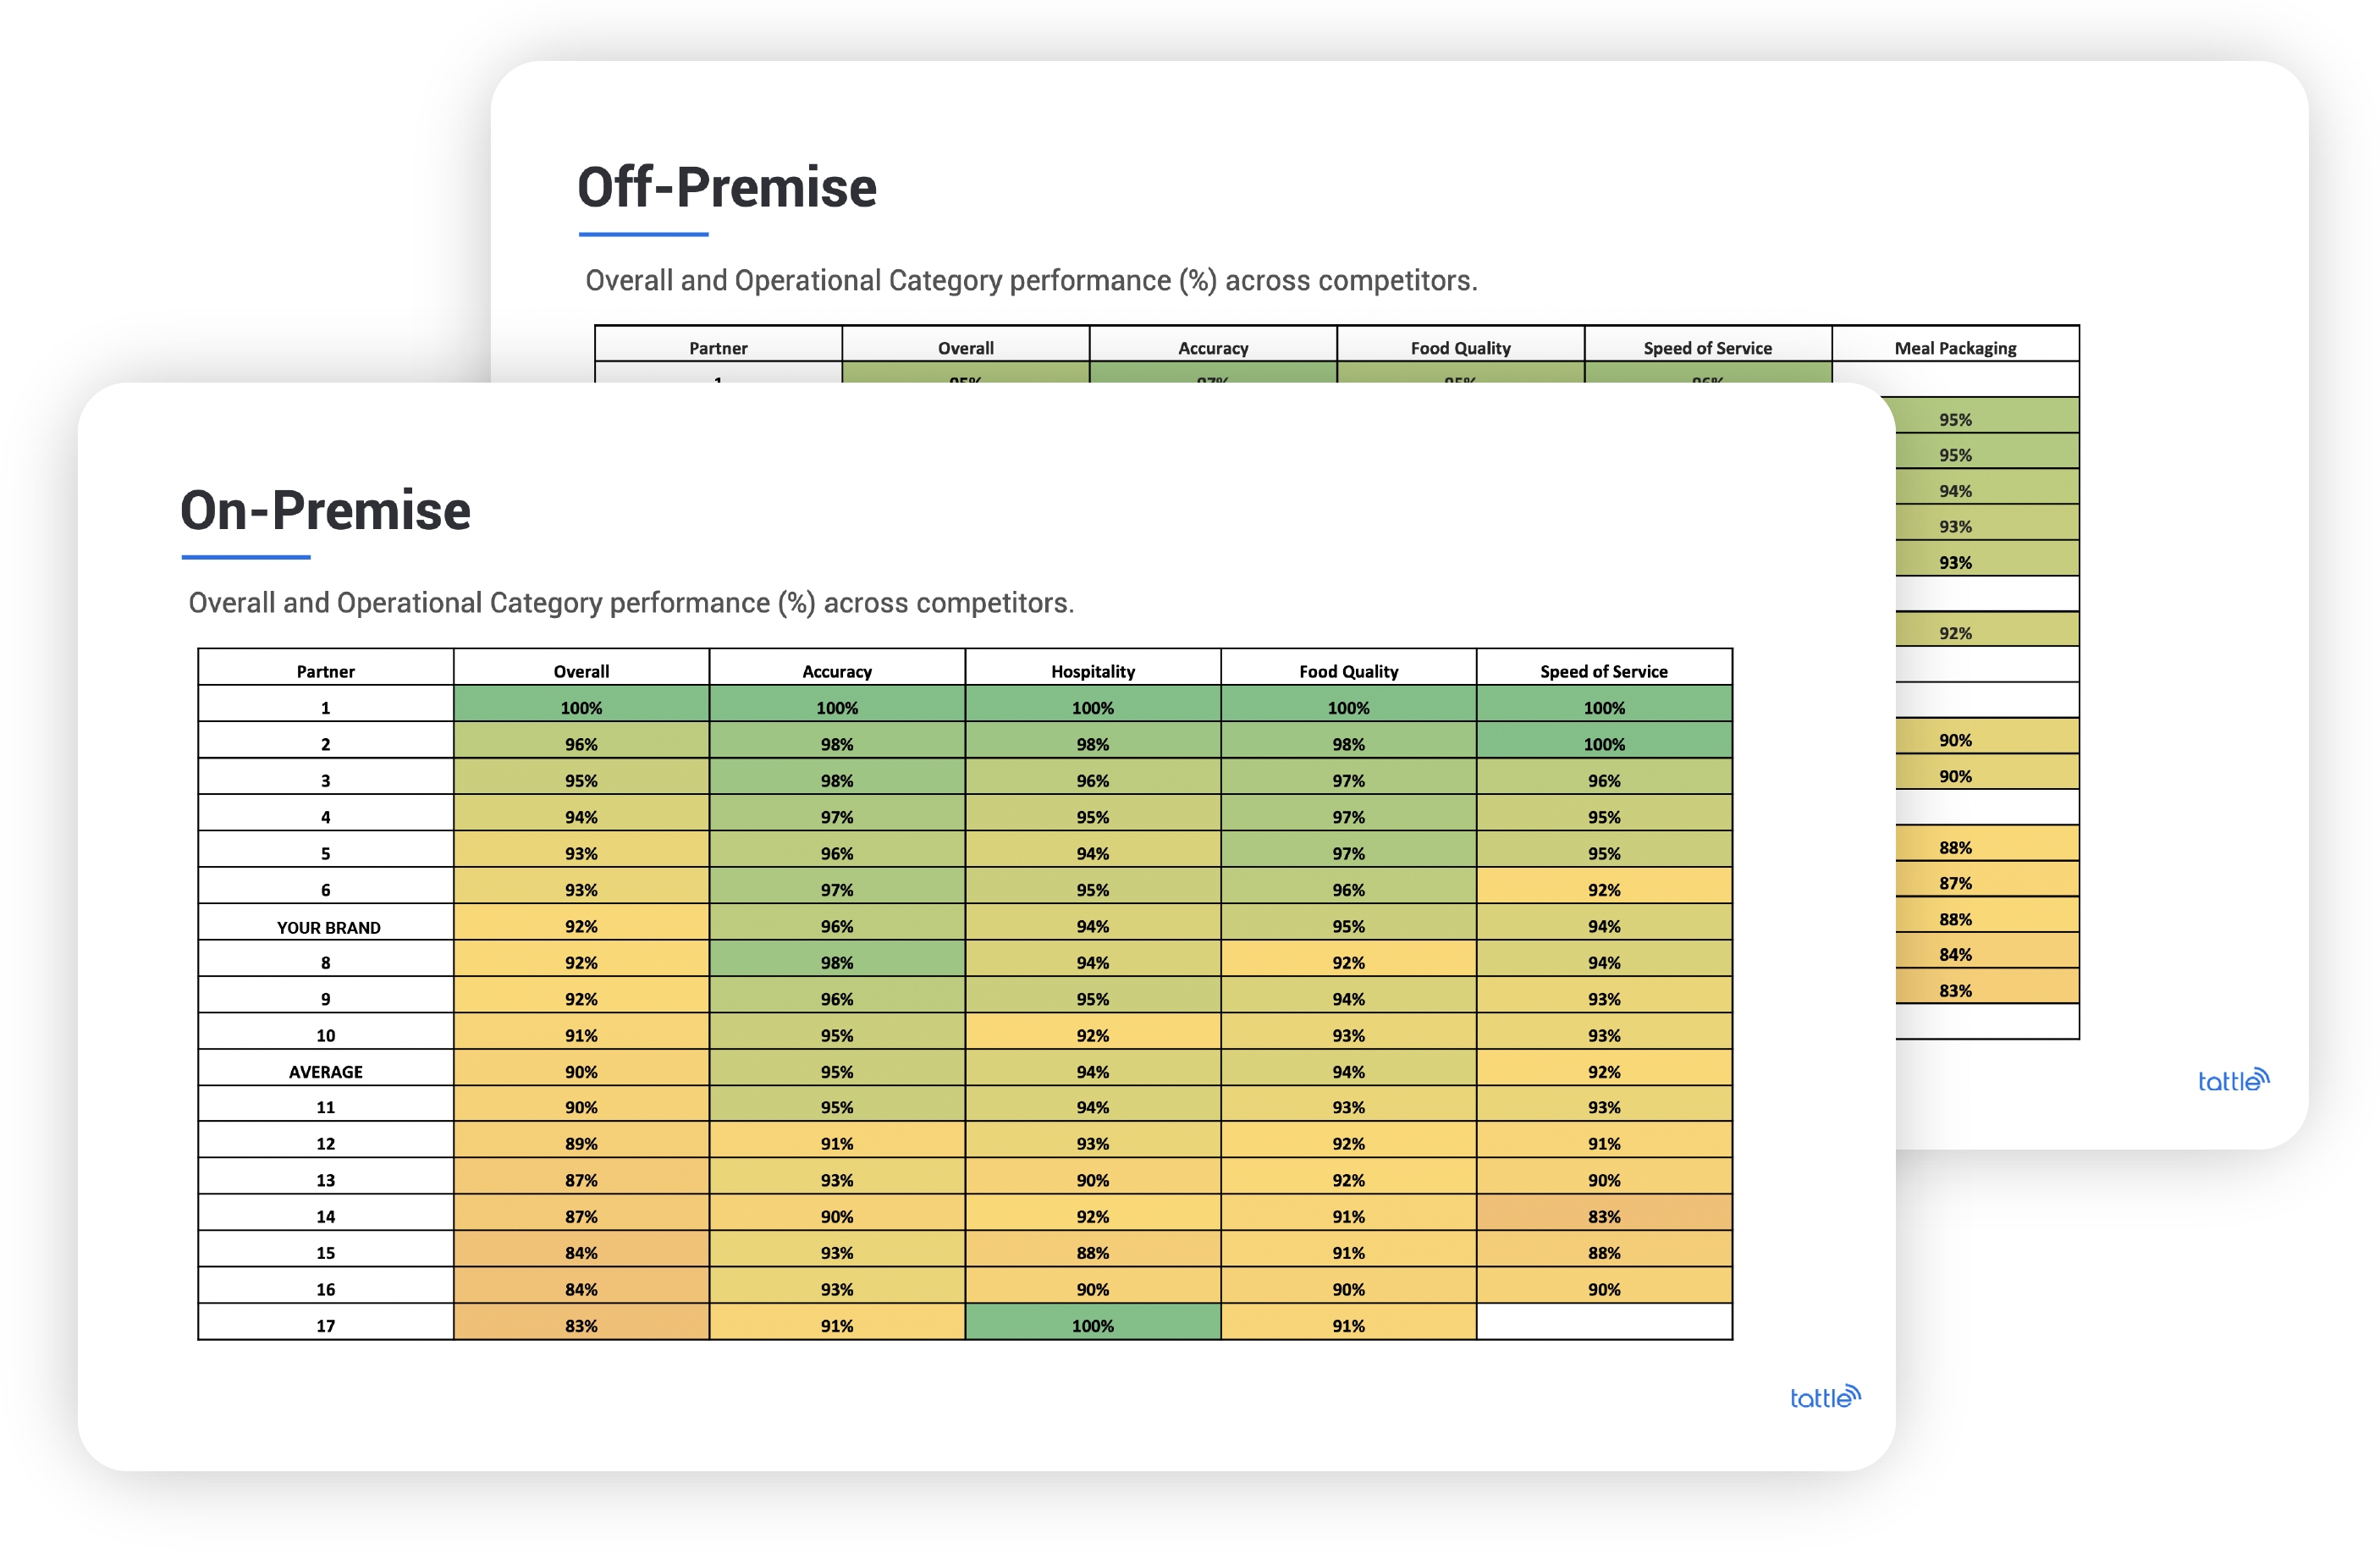
Equipped with data like this, some Tattle partners have been able to achieve massive improvement in their rankings within just one year, rising from below average to #1 on the chart by focusing their efforts on the highest opportunities as identified by Tattle.
If you are a Tattle partner, please reach out to your customer success manager to get your hands on the latest Q1 2022 Industry Benchmarking Report. If you’re not a Tattle partner and are still interested in learning more about the report, feel free to fill out the interest form below so we understand how to provide the most value for your business.
hbspt.forms.create({ region: "na1", portalId: "3814392", formId: "d3ecbb41-71f4-49d1-aa14-02adb2f3bc96" });