We can no longer treat each restaurant today as a single, uniform entity.
Rather, restaurants are essentially juggling multiple business and operational models under one roof: from providing hospitable on-premise dining experiences to delivering speedy services for off-premise channels. 60% of Americans order delivery at least once per week, and fast food chains report nearly 2/3 of their sales coming through drive-thru, which generates billions of dollars for the industry each month.
Hospitality is now in the logistics business as well.
However, this adaptation is easier said than done. After all, what consumers used to value the most at a restaurant — yes, food — sometimes takes a backseat depending on the ordering channel. In this report, you’ll see that what people value and give restaurants credit for varies greatly from channel to channel.
It’s therefore essential to add one thing to your ammunition: data. Specifically, customer experience and satisfaction data. It is the single source of truth that keeps you on track to providing what your customers uniquely want.
This report is based on data from over 200 restaurant brands across 9,000+ locations and over 10 million survey submissions — over one billion data points.
Let’s jump in!
Part One
Top Opportunities: On- and Off-Premise
In this section, you’ll discover the improvement opportunities unique to each channel and the low-hanging fruit that brands can tackle to quickly improve guest satisfaction.
Overview
The graph below shows the overall guest satisfaction trends over the past twelve months across five primary ordering channels — dine-in, drive-thru, curbside, delivery and takeout.
Dine-in: Consistent with our findings earlier in the year, dine-in tends to be the highest rated channel in terms of customer satisfaction.
Take-out & Curbside: These two channels seem to experience similar patterns of fluctuations and guest experience ratings, perhaps due to them sharing a similar pickup and hand-off process.
Drive-thru: Drive-thru shows the biggest fluctuations in terms of guest satisfaction, and appears to perform better during the summer months than winter months.
Delivery: Perhaps coming at no surprise, delivery experiences are consistently rated the lowest, partially due to the unpredictability of external factors and logistics involved.
Dine-In
As the consistently best-performing channel, dine-in experiences see relatively little variance between the satisfaction rating of different operational categories.
There’s a general increase in satisfaction over time across most categories. Ordering process, speed of service, and hospitality saw the biggest improvement (about 3%). Accuracy continues to be ranked the lowest, with the biggest fluctuation in satisfaction between 4.45 and 4.55.
Take-out
Despite being the second-best performing channel, we’re seeing an overall decline in guest satisfaction across most operational categories in take-out experiences. Specifically:
Food quality: 3.4% decline
Meal packaging: 2% decline
Pickup: 2.4% decline
Value: 10% decline
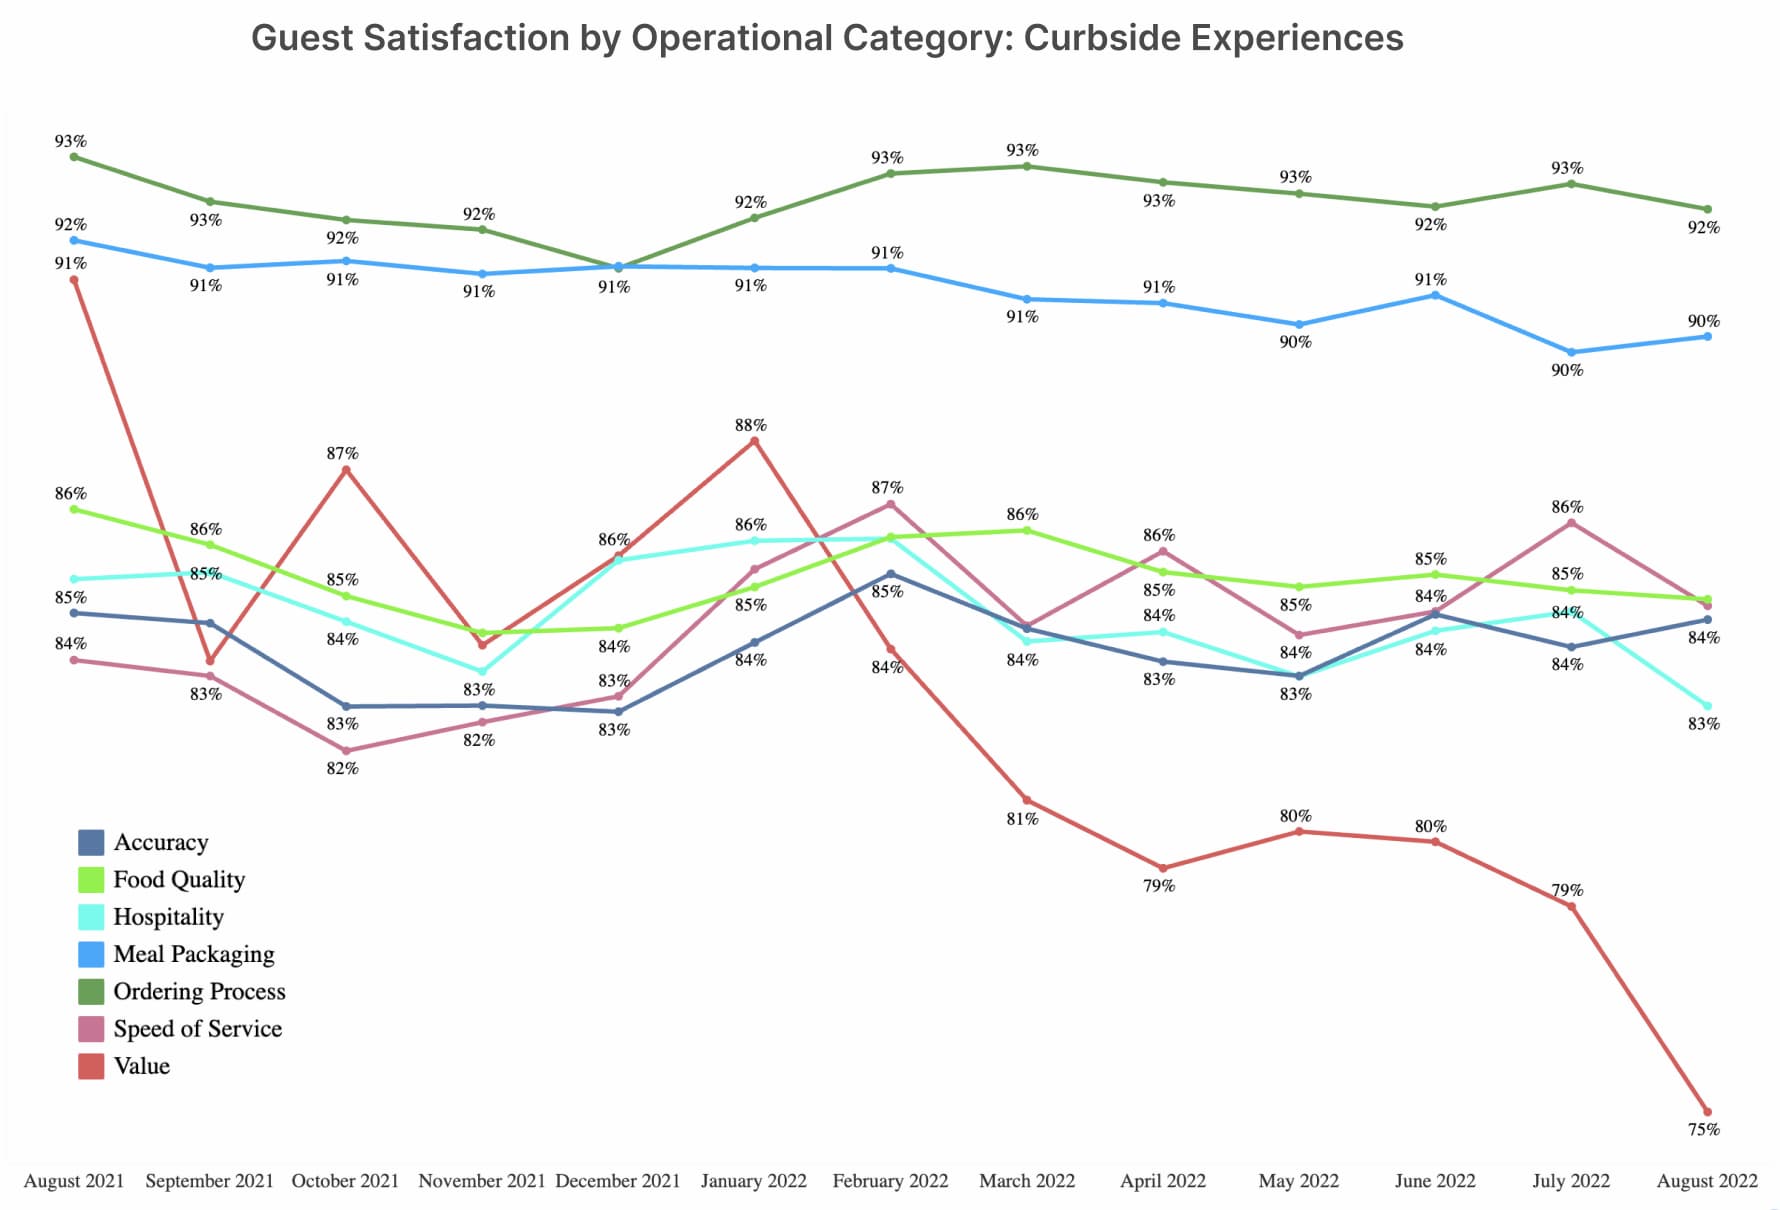
Curbside
Curbside is very similar to pickup and we see similar patterns emerging. Most operational categories have performed fairly consistently over the past 12 months, with ordering process and meal packaging being significantly better than the rest.
The most notable change is the decline in guests’ satisfaction with value — a dramatic 14% drop.
Drive-thru
Although ranked second to last, drive-thru actually has been seeing a slight increase in guest satisfaction across operational categories, despite some pretty big fluctuations:
Ordering process: huge increase of 24%
Speed of service: 10% increase
Food quality: 7.5% increase
Value: major fluctuations between 3.45 and 4.1
Delivery
Lastly, consistent with our prior findings, delivery has always been the lowest ranking channel plagued with logistical issues that affect the overall guest experience. Besides hospitality and value that saw big fluctuations, most operational categories’ performances were fairly consistent. Some notable changes include:
Speed of service: 5% increase
Value: 10% decline


