Insights & Updates
Latest from Tattle
Discover trends, tips, and insights to elevate your restaurant operations.
Discover trends, tips, and insights to elevate your restaurant operations.
 The Tattle Team
Restaurant peak season readiness usually gets measured with inputs: the labor schedule, the prep list, the inventory order, the limited-time offer launch date. Those matter. But they are plans, and plans do not tell you whether a location is actually holding up once the holiday rush starts.
This guide makes the case for one leading indicator that does: guest feedback response rate, the share of guest feedback a location answers or acts on within a set window. We look at what Q4 actually does to restaurant sales and guest scores, using public sales data and two years of Tattle’s own guest feedback data, then cover how to calculate the metric and what to do when it slips.
In this guide
- What restaurant peak season readiness really means
- What Q4 actually looks like in the data
- Why the usual Q4 checklist misses the early warning
- The one metric: guest feedback response rate, defined and calculated
- How to set a target, read it weekly, and act when it drops
- A Q4 readiness scorecard you can copy
- How leading multi-unit brands operationalize this
Restaurant peak season readiness is a location’s ability to keep service speed, order accuracy, food quality, value, and guest recovery steady when demand concentrates, most often across the Q4 holiday period. It is not one task. It is the combined result of staffing, supply, menu execution, and how quickly a team notices and fixes problems while guests are still in the building or just out the door.
Most operators prepare for the first three. The fourth, noticing and fixing problems fast, is where brands tend to come apart, because it is the first thing to get dropped when a team is busy.
Two data sets give a clearer picture of the season than the usual assumptions do.
According to the U.S. Census Bureau’s Monthly Retail Trade data, food services and drinking places sold $100.8 billion in October 2025, $96.3 billion in November, and $99.5 billion in December (not seasonally adjusted). The year’s high was May, at $106.0 billion.
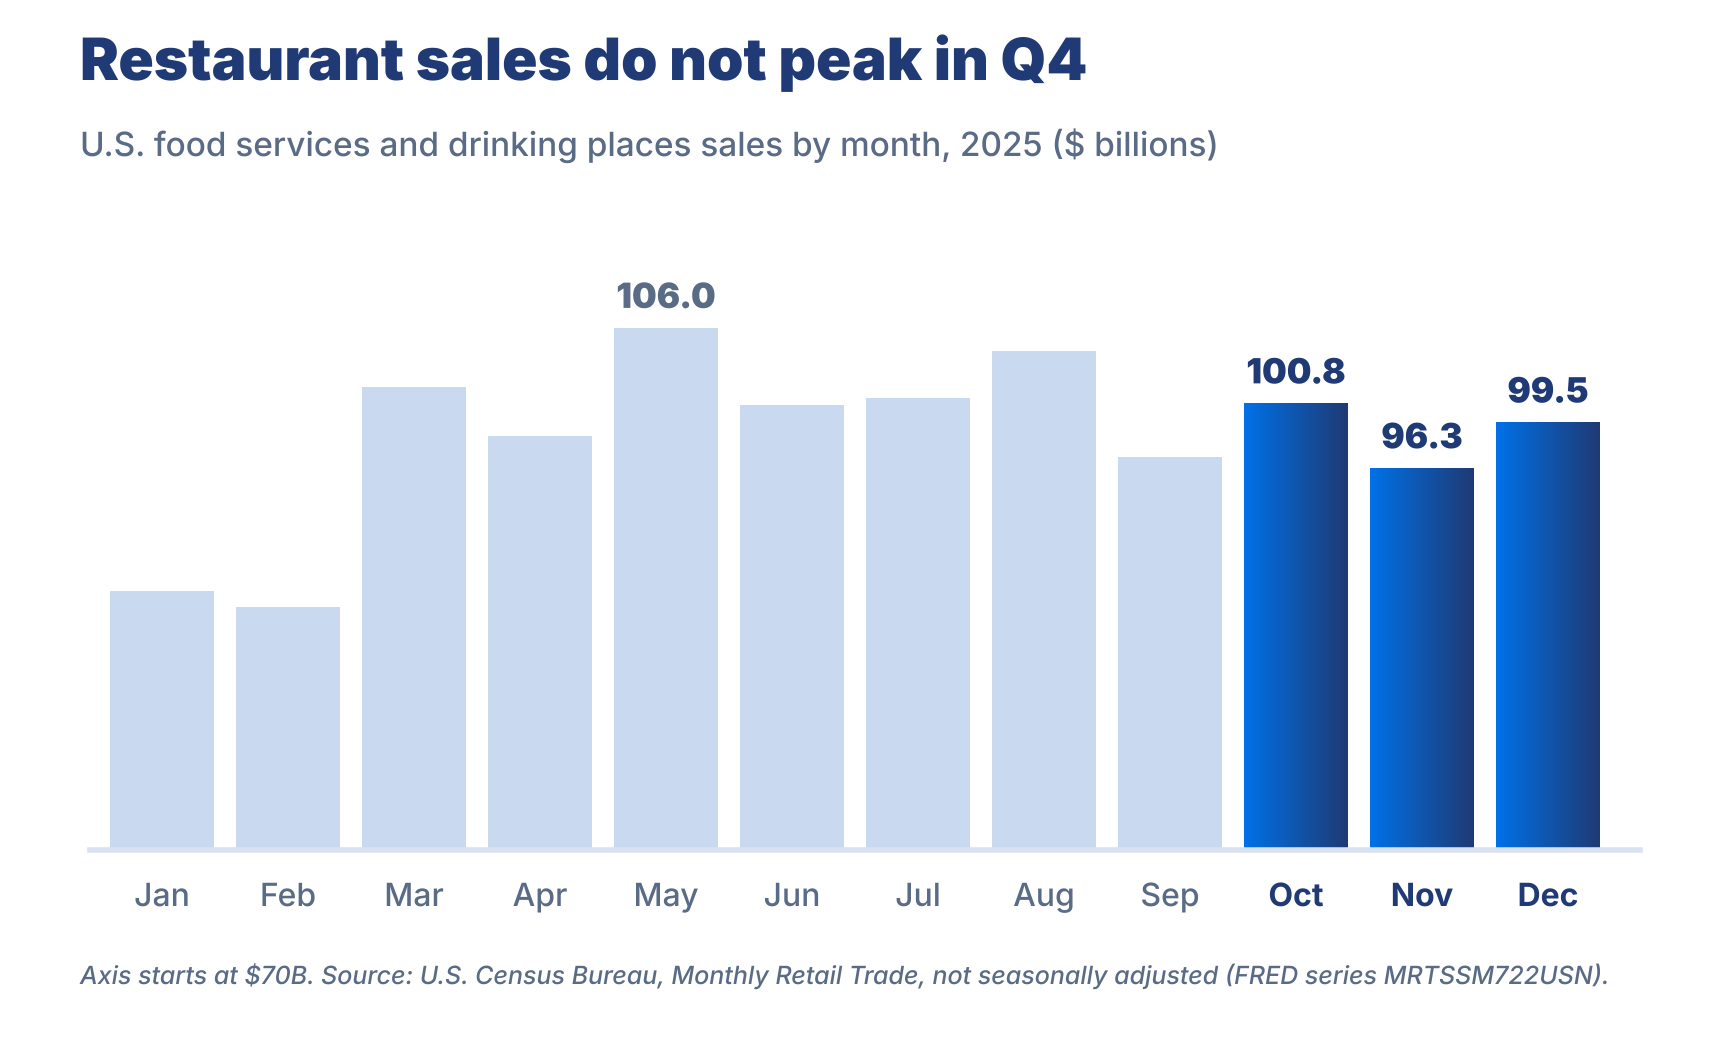
So for the industry as a whole, Q4 is not a monthly volume peak. What changes is where the volume lands: on specific days, dayparts, catering orders, and locations near shopping and travel, while teams are covering holidays and time off. That is a harder problem than a steady surge, because it hides inside averages.
Tattle’s guest feedback data across partner brands shows the same pattern from the guest’s side, and it has now shown up two Q4s in a row. From October to December 2025, the average value score (0 to 100) fell from 86.2 to 85.2, a drop of 1.0 point, while speed of service, hospitality, food quality, and accuracy each moved 0.4 points or less. The same thing happened in 2024: value fell 1.1 points, from 85.8 in October to 84.7 in December, and the other four categories again stayed within 0.3 points. In 2024, value then rebounded to 86.2 in January.
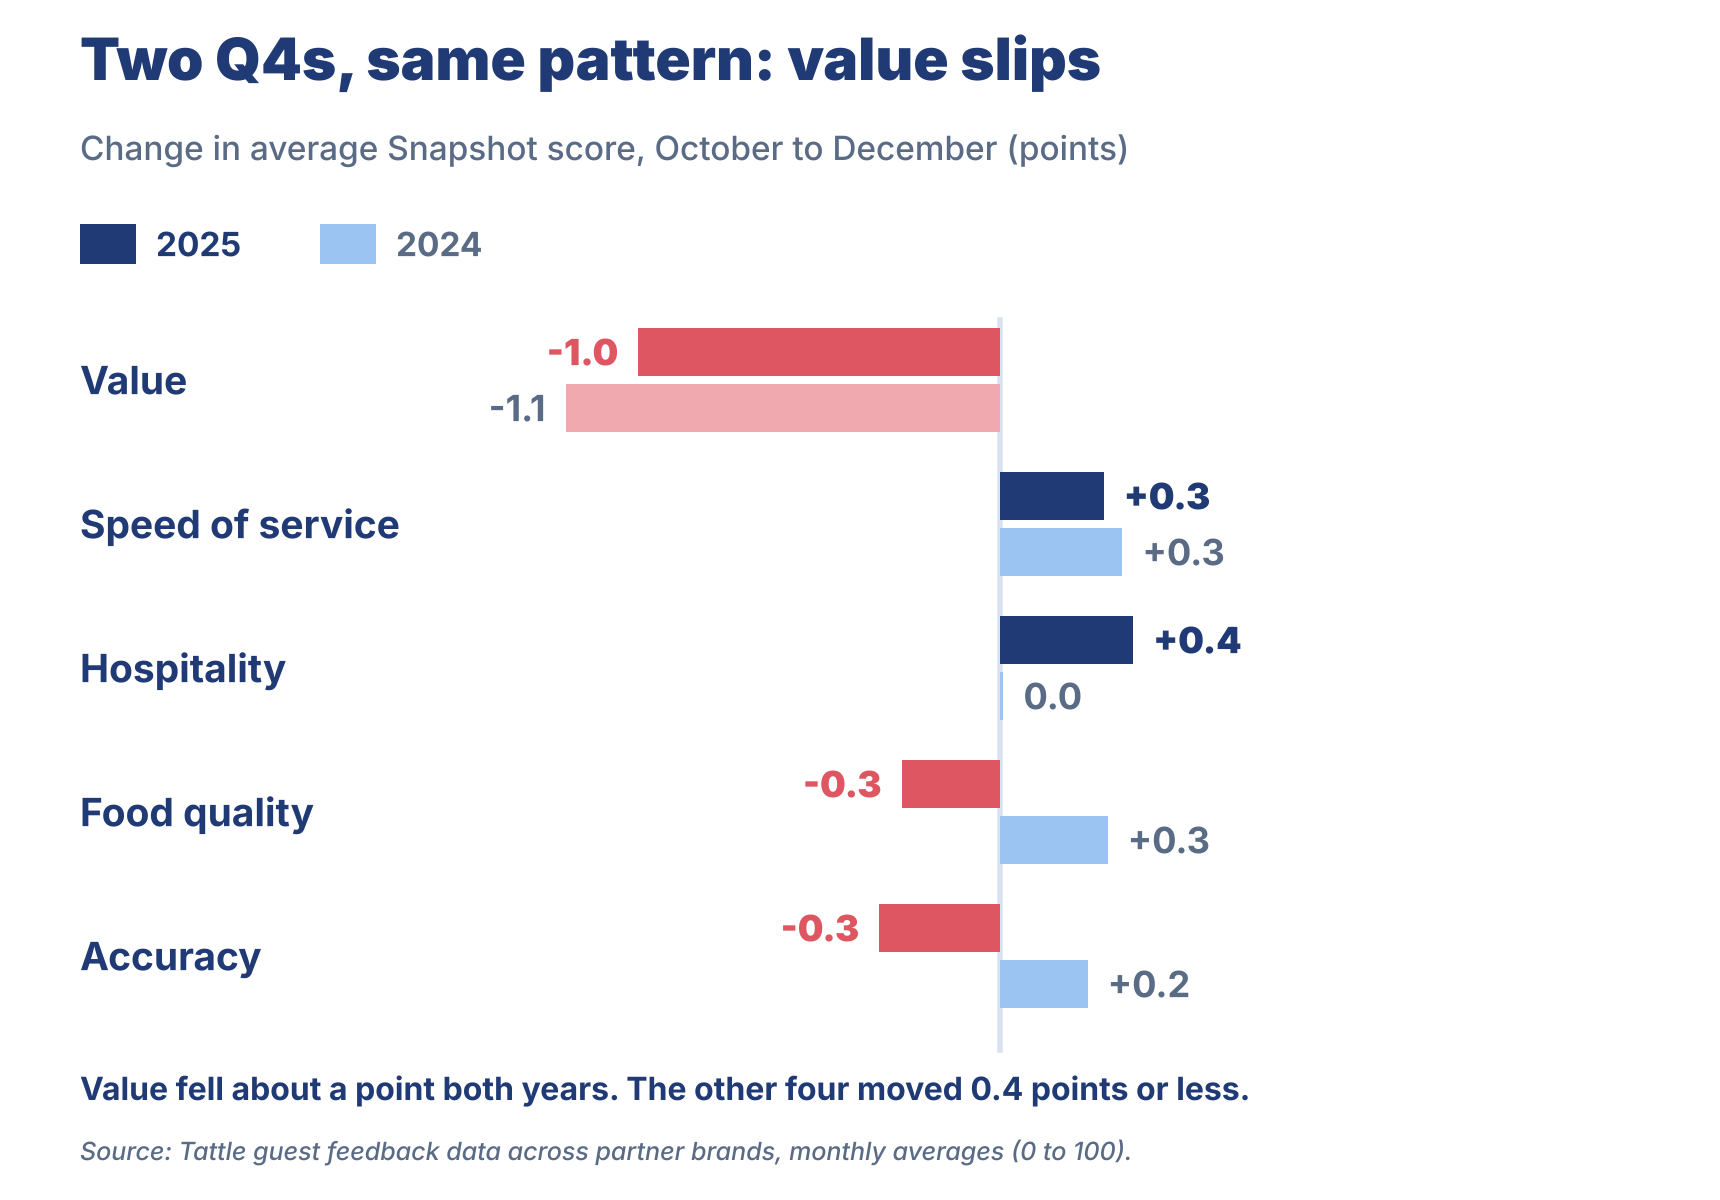
Two things follow for restaurant peak season readiness. First, a brand that prepares can hold its operational scores through the holidays: the industry average did, two years in a row. Second, the average is not the location. A flat brand-wide score can hide a handful of stores that are underwater, and value perception, which rises and falls with holiday pricing, bundles, and limited-time offers, is the score most likely to move.
A standard restaurant Q4 operations checklist is built from inputs: labor forecast, inventory and supplier lead times, menu readiness, equipment checks. It answers “did we prepare?” It does not answer “is it working?”
The usual ways of checking whether it is working all lag. Monthly scores average a month of visits together, and the brand average blends strong and struggling locations into one number. By the time a problem shows up in a monthly report, it has been running for weeks.
Labor adds to the squeeze. The U.S. Bureau of Labor Statistics reports a total separations rate of 4.9% for accommodation and food services in August 2026. That is a monthly rate, so turnover keeps adding newer team members to the schedule right up to the holidays.
Guest feedback response rate is the percentage of guest feedback that receives a real answer or action from the location within a defined window. Feedback here means anything a guest sends you about a visit: survey comments, complaints, and public reviews. A response is a reply or a recovery action, not an automated receipt.
Formula
Guest feedback response rate = feedback answered or acted on within the window ÷ feedback that called for a response × 100
This is a working definition for operating purposes, not an industry-standard benchmark. Pick a window that fits your brand, 48 hours is a reasonable starting point, and hold it constant so the trend means something.
The response rate moves before scores do because it measures capacity, not outcomes. A manager can only answer the guests they have time to answer. When a location falls behind on a busy week, the response rate drops that week, for the same reason speed, accuracy, and hospitality are at risk: the people are stretched. A monthly score will show the damage later, and only after it is averaged in with everything else.
It also matches where the Q4 risk sits. Value complaints are often about price, portion, or a promotion that did not land, and many are recoverable with a timely, specific response. A location that stops answering is a location where those complaints pile up unaddressed.
There is academic support for the idea that responding changes outcomes, with a caveat. In a study published in Marketing Science, Davide Proserpio and Giorgos Zervas examined hotel reviews on TripAdvisor and found that hotels that began responding to reviews saw their ratings rise by an average of 0.12 stars and received 12% more reviews. That is hotel data, not restaurant data, so treat it as directional evidence that responding matters rather than a number to expect for your brand.
Treat this as a weekly operating habit, not a year-end report. Six steps:
A falling response rate is a prompt to act, not a verdict. Work through it in this order.
First, protect the unhappy guests. Triage so the lowest-scoring and most serious feedback gets answered first, even if the rest waits.
Second, find out why. A dip at one location usually points to local staffing or a manager out. A dip across many locations points to a process or volume problem that coaching alone will not fix. If value comments are rising at the same time, look at holiday pricing and promotions before you look at the team.
Third, move capacity. Shift a district manager’s time, share the response load across a market, or simplify what a location is expected to answer personally.
Fourth, protect the team. Holiday burnout rarely arrives all at once. It builds as a team falls behind and stays behind. Catching the slip in week two, instead of week six, is one of the more practical ways of avoiding restaurant team burnout during the holidays.
The response rate is the leading indicator, but it is easier to act on when it sits next to a few other signals. This scorecard puts five of them in one view.
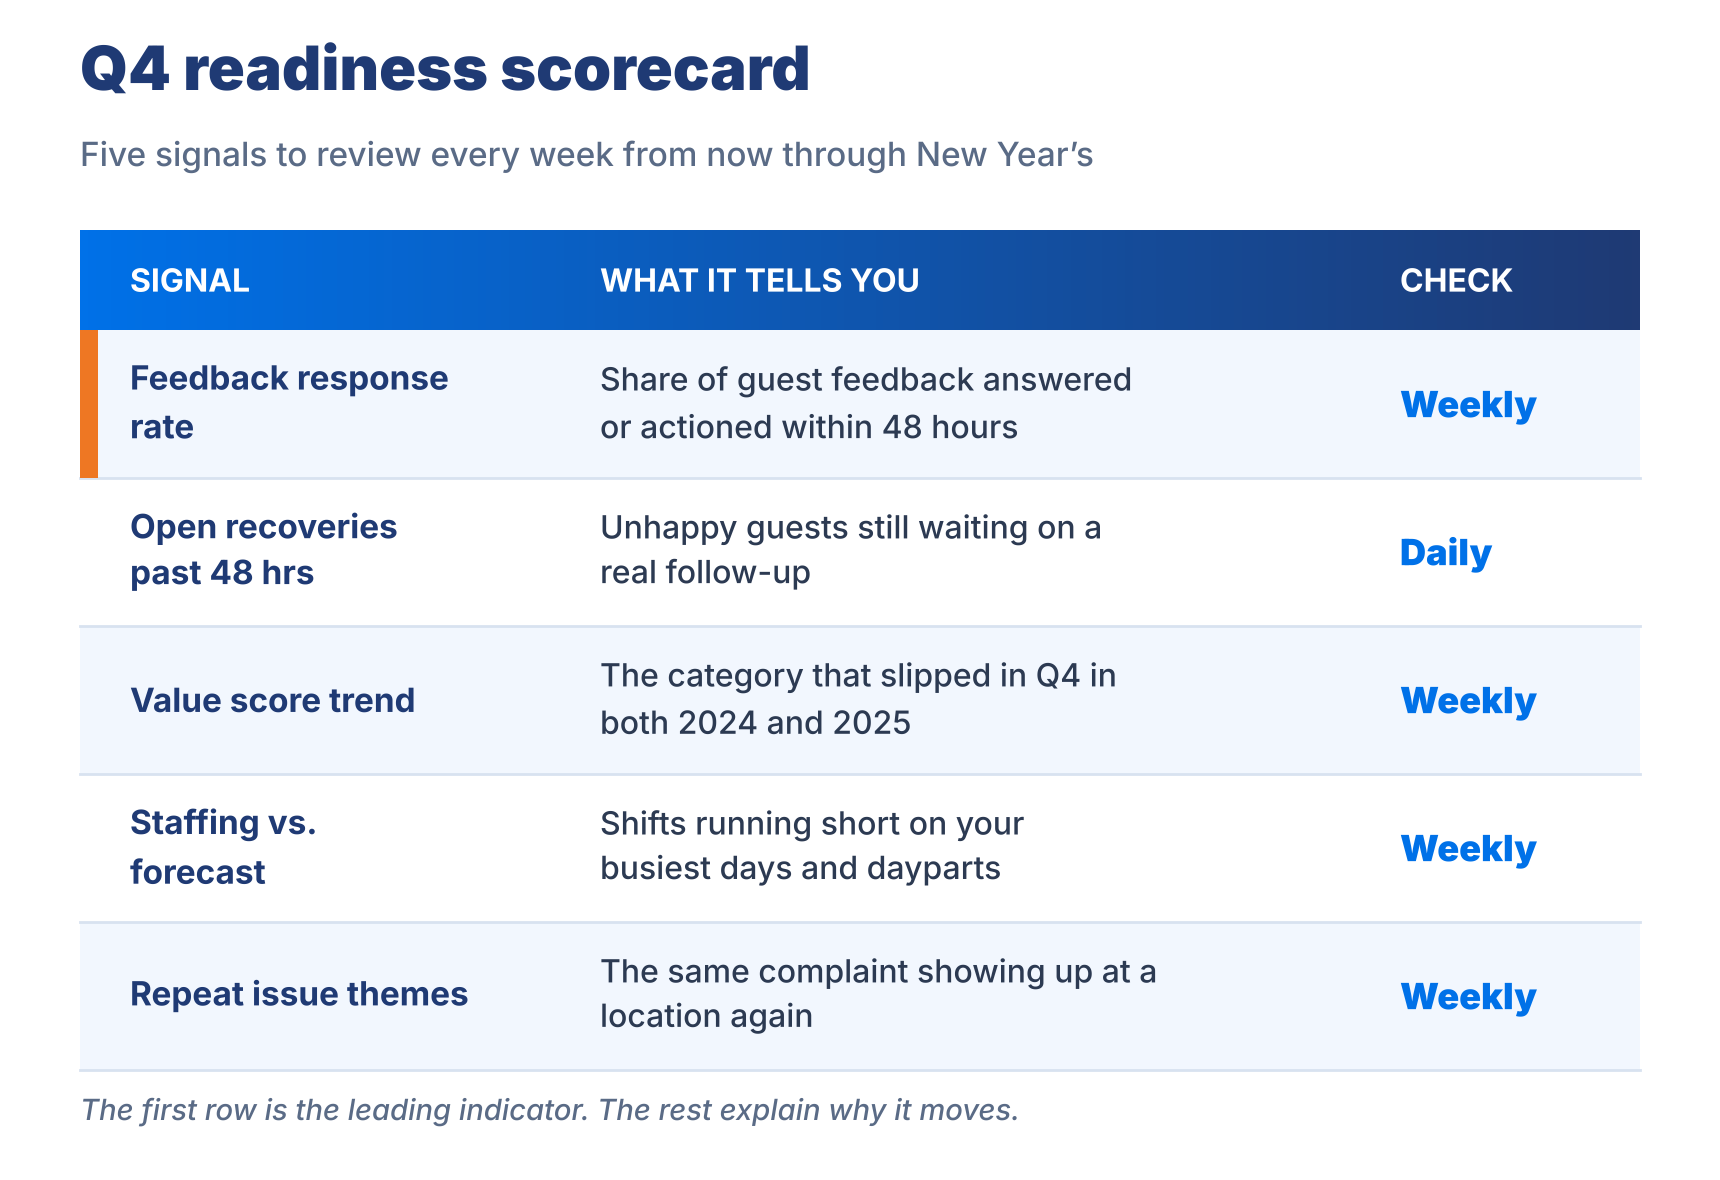
Together they cover the loop: are guests being heard, are unhappy guests being recovered, is value perception moving, are shifts covered on the days that matter, and is the same problem repeating. If you are planning holiday rush restaurant staffing, these are the numbers that tell you whether the plan is holding.
Tattle is a Customer Experience Improvement platform for multi-unit restaurants. It collects guest feedback across dine-in, drive-thru, pickup, and delivery, pinpoints the operational causes behind it, and drives action at the location level. For peak season, three parts matter most.
Guest Recovery surfaces unhappy guests in real time, so the team can see who is waiting on a follow-up and win them back before a public review goes up. That makes the pile of unanswered feedback visible instead of letting it quietly grow. See how Guest Recovery works.
AI Coach turns each location’s feedback into prioritized, SOP-aligned action items for the GM. During a rush, a manager has no time for a dashboard of metrics. One clear priority is the version that gets done. See how AI Coach works.
Causation-based surveys tie feedback to the operational factor behind it, such as speed, accuracy, food, hospitality, or value. That is what made the Q4 pattern above visible: a brand-wide score would have shown nothing, while the category view shows value moving on its own.
For a sense of what recovery looks like at scale, see the MOD Pizza success story.
Restaurant peak season readiness is how prepared a brand is to keep service, food quality, and guest recovery steady when volume spikes, most often in Q4. It covers staffing, inventory, and menu planning, but the clearest test is whether guests who have a problem still get heard while the rush is on.
Guest feedback response rate is the share of guest feedback, such as survey comments and public reviews, that a location answers or acts on within a set window, for example 48 hours. Divide the feedback answered inside the window by the feedback that called for a reply, then track the result weekly by location.
It predicts Q4 performance because it measures spare capacity at the location level before ratings fall. When a team can no longer answer the guests who reach out, the same strain is usually showing up on the floor, in speed, accuracy, and hospitality. Reviews and ratings lag that strain by weeks, so the response rate shows it first.
Not across the board. In Tattle guest feedback data, average value scores fell about a point from October to December in both 2025 and 2024, while speed of service, hospitality, food quality, and accuracy moved 0.4 points or less. The holiday risk is concentrated in specific locations and in how guests judge value, not in a broad decline.
Plan holiday rush restaurant staffing by forecasting volume per location, scheduling to the forecast instead of last year’s roster, and protecting a small share of capacity for guest follow-up. Then check weekly whether shifts are running short and whether response rate is holding, so you can adjust before the busiest weeks.
A restaurant Q4 operations checklist should cover labor forecast, inventory and supplier lead times, menu and limited-time-offer readiness, equipment checks, and a guest feedback plan. The feedback plan sets a response window, names who answers, and defines when a GM escalates an unhappy guest.
Restaurants avoid holiday burnout by cutting avoidable rework, setting a clear priority for each manager, and noticing early when a team falls behind. A falling feedback response rate is one early signal that a location is stretched, which lets a district leader add support before the team is worn down.
Tattle helps by surfacing unhappy guests in real time through Guest Recovery and turning each location’s feedback into prioritized, SOP-aligned action items for the GM through AI Coach. Tattle is a Customer Experience Improvement platform for multi-unit restaurants.
If you want to see how a multi-unit brand can spot unanswered guests and slipping locations before the holiday rush, watch a Tattle demo.