Insights & Updates
Latest from Tattle
Discover trends, tips, and insights to elevate your restaurant operations.
Discover trends, tips, and insights to elevate your restaurant operations.
 The Tattle Team
Restaurant guest experience is the sum of every impression a guest forms about your brand, from the moment they search for you to the moment they decide whether to come back. It is not the same as customer service, and it is not the same as your star rating. It is the whole arc, and in 2026 it is the variable most likely to decide whether a location grows traffic or quietly loses it.
The pressure is measurable. Sales at the 500 largest U.S. chains grew just 3% in 2025, to $451.5 billion, which trailed the 3.8% menu-price inflation rate for the year, according to Technomic’s Top 500 report. The median chain in that group grew 2.5%, which works out to a 1.3% decline once you adjust for menu prices. Growth is coming from price, not from more people walking in. When you cannot raise prices any further, experience is the only lever left.
This guide covers what guest experience actually is, where it is won and lost, which drivers you can control, how to measure it, and how to stand up a program across a multi-unit footprint in 90 days.
Want the condensed version? Everything below is also available as an 8 page field guide you can print or send to your ops team: the five-stage guest journey, the six drivers, the metrics worth tracking, and the 90-day plan.
In this guide
- What restaurant guest experience means (and how it differs from service and satisfaction)
- Why it matters more in 2026 than it did three years ago
- The five-stage guest journey
- The six drivers of guest experience operators actually control
- How to measure guest experience without drowning in metrics
- A 90-day plan to build a guest experience management program
- Five mistakes that stall multi-unit programs
- How leading multi-unit brands do this with Tattle
- FAQ
Restaurant guest experience is the total impression a guest forms across every interaction with your brand, including discovery, ordering, the meal itself, and everything that happens afterward. It spans channels (dine-in, drive-thru, pickup, delivery), touchpoints (app, kiosk, counter, table, phone), and time (a single visit and the accumulated memory of many visits).
Three terms get used interchangeably. They are not the same thing.
The practical difference matters. A brand can have excellent service and a poor guest experience if the app crashes, the drive-thru line is 14 minutes, or the delivery order arrives missing an item. Guest experience management is the discipline of running all of that as one system rather than as separate departments.
Guest tolerance has narrowed, and the consequences of a bad visit now show up faster in revenue.
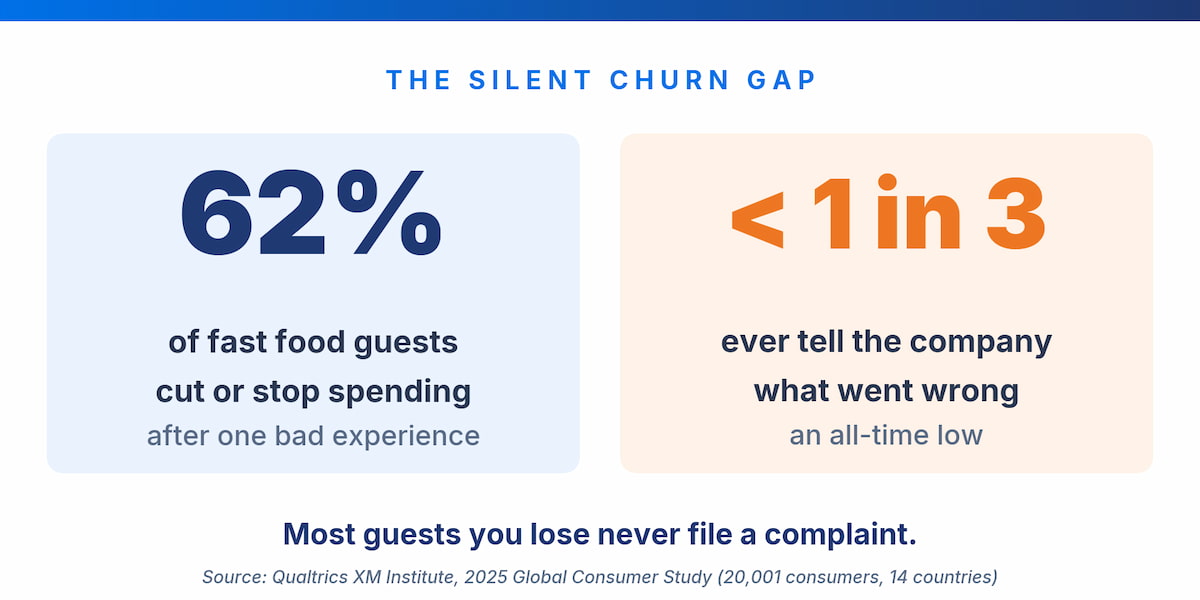
Fast food is the industry where a poor experience is most likely to cost you money. In Qualtrics XM Institute’s 2025 Global Consumer Study of 20,001 consumers across 14 countries, 62% of fast food customers said they would stop or reduce spending after a problem, the highest share of any of the 18 industries measured. Across all industries, 34% of consumers reduce spending after a negative experience and 13% cut it entirely.
The same study found something more uncomfortable: fewer than 1 in 3 consumers give feedback directly to companies, an all-time low. Most of the guests you lose are not complaining. They are just not coming back.
Tillster’s 2026 Phygital Index Report, based on a survey of 2,144 U.S. diners, found that 45% of diners said their favorite restaurant chain changed in the past year, up from 33% in 2025. Being the default choice is no longer protection. The same research put the top three factors in choosing where to eat at food quality (45%), convenience (44%), and speed (34%), all three of which are operational outcomes rather than marketing outcomes.
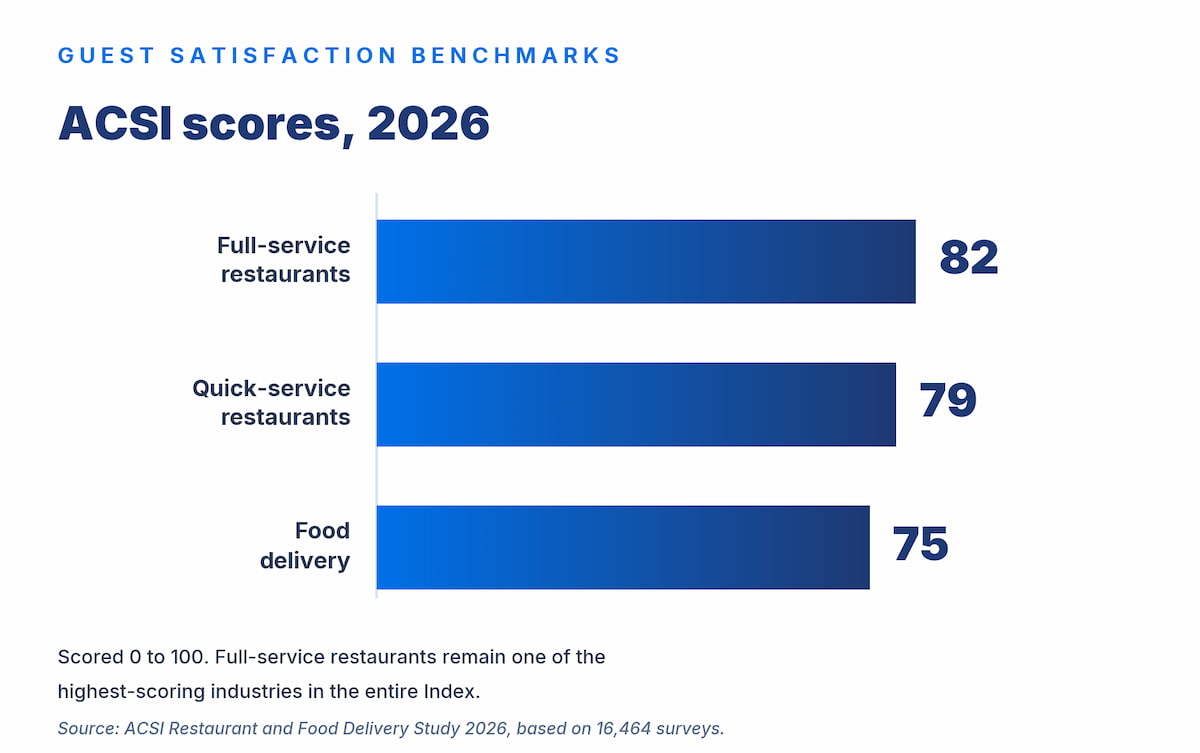
Industry-level satisfaction has been flat. The American Customer Satisfaction Index’s Restaurant and Food Delivery Study 2026, based on 16,464 surveys collected between April 2025 and March 2026, put quick-service restaurants at 79 for the third consecutive year and full-service restaurants at 82.
Stable averages hide real movement underneath. As Forrest Morgeson, Associate Professor of Marketing at Michigan State University and Director of Research Emeritus at the ACSI, put it in the study release: “Price still matters, but it’s no longer enough on its own. Consistency across the full experience is what separates the leaders right now, and that’s showing up clearly in the data.”
Consistency is a multi-unit problem specifically. A brand average of 82 can be built from locations at 91 and locations at 68, and the guest at the 68 does not care about the average.
The guest journey is the sequence of stages a guest moves through with your brand. Mapping it matters because problems in early stages are invisible in operational data, and problems in later stages are invisible in marketing data.
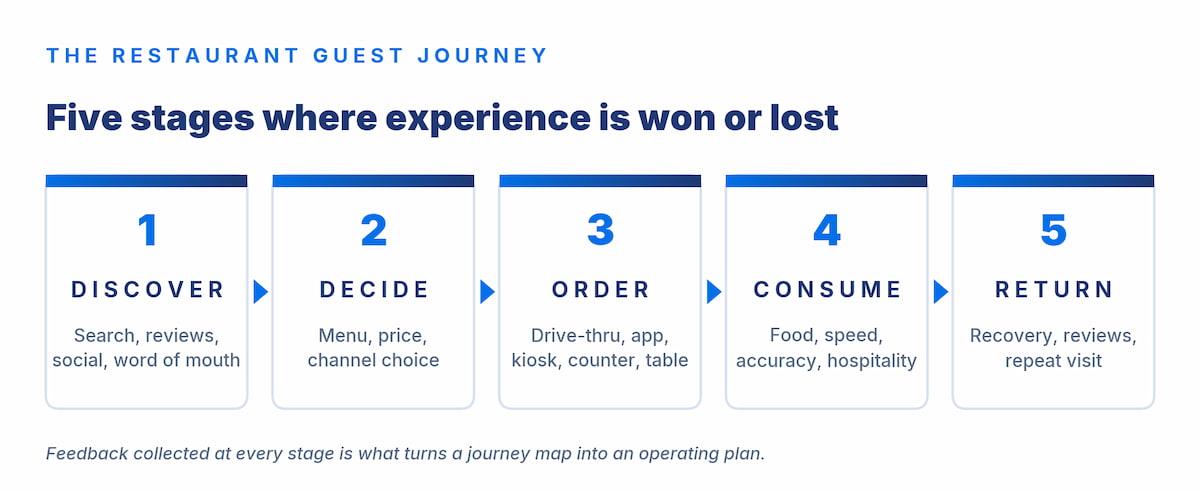
The guest finds you through search, review sites, social, delivery marketplaces, or word of mouth. What they see here is mostly the residue of other guests’ experiences: your star rating, your recent reviews, your photos. This stage is downstream of everything else you do.
The guest weighs your menu, price, location, and channel options against alternatives. Value perception forms here, and value is not the same as price. A guest who pays more and gets exactly what they expected perceives better value than one who pays less and waits 20 minutes.
The transaction itself: drive-thru speaker, app, kiosk, counter, table, or a third-party marketplace. This is where the most friction is designed in rather than accidental. Confusing menus, broken promo codes, and loyalty rewards that cannot be redeemed in the channel the guest chose all live here.
The meal. Food quality, temperature, accuracy, speed, hospitality, and cleanliness. This is the stage most operators already measure, and it is still where the largest share of dissatisfaction originates.
What happens after. Did you find out something went wrong? Did you fix it? Did the guest leave a public review, and did anyone respond? A guest with a problem that gets resolved often ends up more loyal than a guest who never had a problem, but only if you learn about the problem in time to act.
The five stages are not equally instrumented at most brands. Most have good data on stage 4, some data on stage 5, and almost none on stages 1 through 3.
Macro conditions are not controllable. These six are, and they map cleanly to what diners say drives their choices.
The single largest driver, and the one guests are least willing to trade away. Tillster’s 2026 research found food quality was the top factor for 45% of diners overall and 52% of Gen Z diners. The multi-unit question is not “is our food good” but “is our food the same at 3 p.m. on a Tuesday in store 47 as it is at noon on Saturday in store 12.”
What to measure: food-specific satisfaction by location, by day-part, and by item.
Accuracy is the driver that has grown most in importance as off-premise volume has grown, because a wrong order in the dining room can be fixed in two minutes and a wrong order in a delivery bag cannot be fixed at all. The ACSI’s 2026 study noted gains in order accuracy across both full-service and quick-service restaurants, which suggests brands are actively investing here.
What to measure: accuracy rate split by channel. Dine-in and delivery accuracy are different operational problems.
Speed is a top-three decision factor for 34% of diners overall and 37% of Millennials, per Tillster. Speed also interacts with the others: guests forgive a slower experience when the food is right and the staff is warm, and forgive nothing when it is slow and wrong.
What to measure: actual throughput times alongside perceived wait. They diverge, and perceived wait is what shows up in reviews.
The human layer. It is the driver most sensitive to turnover and to whether your GMs are coaching or firefighting. It is also the driver that most reliably rescues an otherwise bad visit.
What to measure: staff-specific satisfaction, and its correlation with location-level turnover.
A hygiene factor in the technical sense: excellent cleanliness rarely wins you a guest, and poor cleanliness reliably loses one. It is also one of the most common themes in negative public reviews.
What to measure: cleanliness mentions in guest feedback and review text, by location.
Value is the ratio between what a guest paid and what they got. In an environment where 69% of diners told Tillster they had decreased or maintained their dining-out budget, value perception is under constant review. The lever here is usually the numerator (deliver more) rather than the denominator (charge less).
What to measure: value-specific satisfaction tracked against your own price changes.
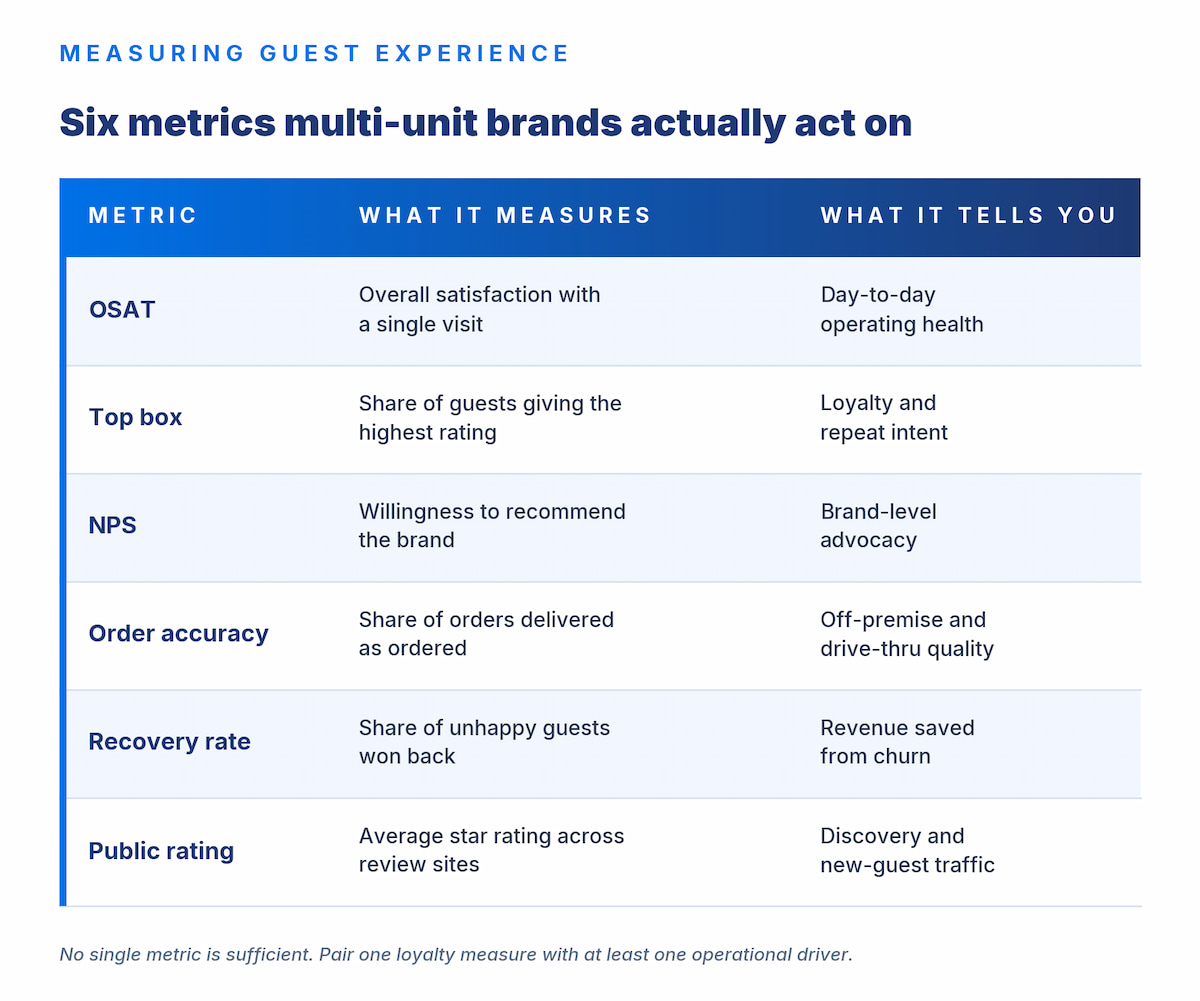
Use one loyalty-oriented metric and at least one operational driver metric, then hold every location accountable to both. A single number cannot tell you whether guests are happy and why, and most programs stall because they picked one metric and stopped.
Three practical rules:
For a deeper comparison of the loyalty metrics specifically, see our breakdown of the differences between OSAT, NPS, and CSAT.
Guest experience management for a restaurant brand is the operating system that turns feedback into location-level action. Here is a realistic sequence for a multi-unit rollout.
Tattle is a Customer Experience Improvement platform for multi-unit restaurants. It is built for the specific problem this guide describes: collecting guest feedback across every channel, identifying the operational cause behind a score, and pushing that down to the location level as something a GM can act on.
Three parts of the platform map directly to the framework above.
Causation-based surveys and the Customer Experience Rating. Rather than asking for a single overall rating, Tattle’s surveys are structured to isolate why satisfaction moved across the drivers described above, including food, speed, accuracy, and hospitality. The Customer Experience Rating (CER) is Tattle’s satisfaction score, positioned as a leading indicator of future performance. Feedback is collected across dine-in, drive-thru, pickup, and delivery, which is what closes the off-premise measurement gap most brands have.
Guest Recovery surfaces unhappy guests in real time so a manager can reach them before the visit becomes a public review. This is the direct counter to the silent-churn problem: it converts the guests who would have quietly stopped coming into guests you get a second chance with.
AI Coach turns each location’s feedback into prioritized, SOP-aligned action items for GMs, and Monthly Objectives give each location a single focused improvement goal. Together they address the “dashboard with 14 metrics” failure mode: the system decides what matters most at that location this month.
For reputation, Review Management connects the public review layer to the same feedback system, so stage 1 and stage 5 of the journey are managed together rather than by two different teams. A full view of the platform is on the all-in-one CX platform page.
Brands including MOD Pizza, Chopt, Dos Toros, Sonny’s BBQ, and Cotton Patch Cafe use Tattle to run guest experience across their footprints.
Restaurant guest experience is the total impression a guest forms across every interaction with a brand, including discovery, ordering, the meal, and everything that follows. It is broader than customer service, which is only the staff interaction, and broader than guest satisfaction, which is a measurement of the experience rather than the experience itself.
Customer service is one part of guest experience. Customer service covers how staff interact with guests, while guest experience covers the entire journey including discovery, ordering channels, food quality, accuracy, speed, cleanliness, and post-visit recovery. A restaurant can have friendly staff and still deliver a poor guest experience if the app fails or the order is wrong.
Measure it with one loyalty metric and at least one operational driver metric, segmented by location, channel, and day-part. Common choices are overall satisfaction (OSAT) or top-box score for the loyalty side, paired with order accuracy, speed, or a recovery rate on the operational side. A single brand-level number is not actionable for a multi-unit operator.
Food quality, order accuracy, speed of service, hospitality, cleanliness, and value perception are the six drivers operators control. Tillster’s 2026 Phygital Index Report found that diners rank food quality (45%), convenience (44%), and speed (34%) as their top three factors when choosing where to eat.
More than in almost any other industry. Qualtrics XM Institute’s 2025 Global Consumer Study found that 62% of fast food customers would stop or reduce their spending after a poor experience, the highest share among the 18 industries measured. Because fewer than 1 in 3 consumers give feedback directly to companies, most of that lost spend happens without any complaint being filed.
Benchmark against your segment rather than against a universal number. In the ACSI Restaurant and Food Delivery Study 2026, full-service restaurants averaged 82 out of 100, quick-service restaurants averaged 79, and food delivery averaged 75. For a multi-unit brand, the more useful target is narrowing the spread between your best and worst locations.
Most multi-unit brands can instrument, baseline, and begin acting within 90 days, though sustained score movement typically follows the operational changes rather than arriving with them. The first 30 days go to measurement coverage across all channels, the next 30 to closing the loop on unhappy guests, and the final 30 to a repeatable monthly coaching cadence.
Tattle is a Customer Experience Improvement platform for multi-unit restaurants that collects guest feedback across dine-in, drive-thru, pickup, and delivery, then identifies the operational causes behind each score. Guest Recovery surfaces unhappy guests in real time so teams can win them back before a public review, and AI Coach converts each location’s feedback into prioritized action items for its general manager.
Guest experience is not a program you finish. It is an operating cadence: measure across every channel, find the cause behind the score, give each location one thing to fix, and check whether it moved. The brands gaining ground in a flat market are the ones that made that loop routine.
If you want to see what that looks like across a multi-unit footprint, book a demo with Tattle.