Insights & Updates
Latest from Tattle
Discover trends, tips, and insights to elevate your restaurant operations.
Discover trends, tips, and insights to elevate your restaurant operations.
 The Tattle Team
The OSAT vs NPS debate has been running in restaurant boardrooms for twenty years, and most brands end up tracking both plus CSAT, plus Top Box, plus a star rating, without ever agreeing on which number actually runs the business. That is an expensive kind of tidy. When four metrics all describe “guest satisfaction,” a district manager reviewing five locations can pick whichever one makes their region look best, and nobody in the room can prove them wrong.
The metrics are not interchangeable. Each one asks a different question, throws away different data, and rewards different behavior on the floor. Run the same guest responses through Top Box, NPS, and OSAT and you can get three different answers about which of your locations is performing best.
This guide breaks down what each metric measures, how to calculate it, what a good score looks like against a credible 2026 benchmark, and how to pick a primary metric your operators will actually act on.
In this guide
- What OSAT, CSAT, NPS, and Top Box each measure
- How to calculate each one, with the formulas
- A worked example where three metrics disagree about the same two locations
- What the research says about NPS and revenue growth
- Current U.S. restaurant satisfaction benchmarks
- Five steps to choosing your primary metric
- How multi-unit brands operationalize this with Tattle
OSAT measures satisfaction with the whole visit, CSAT measures satisfaction with one specific part of it, and NPS measures how likely a guest is to recommend you to someone else. They are three different questions, so they produce three different numbers, and none of them is a substitute for the others.
Here is each one in an operator’s terms.
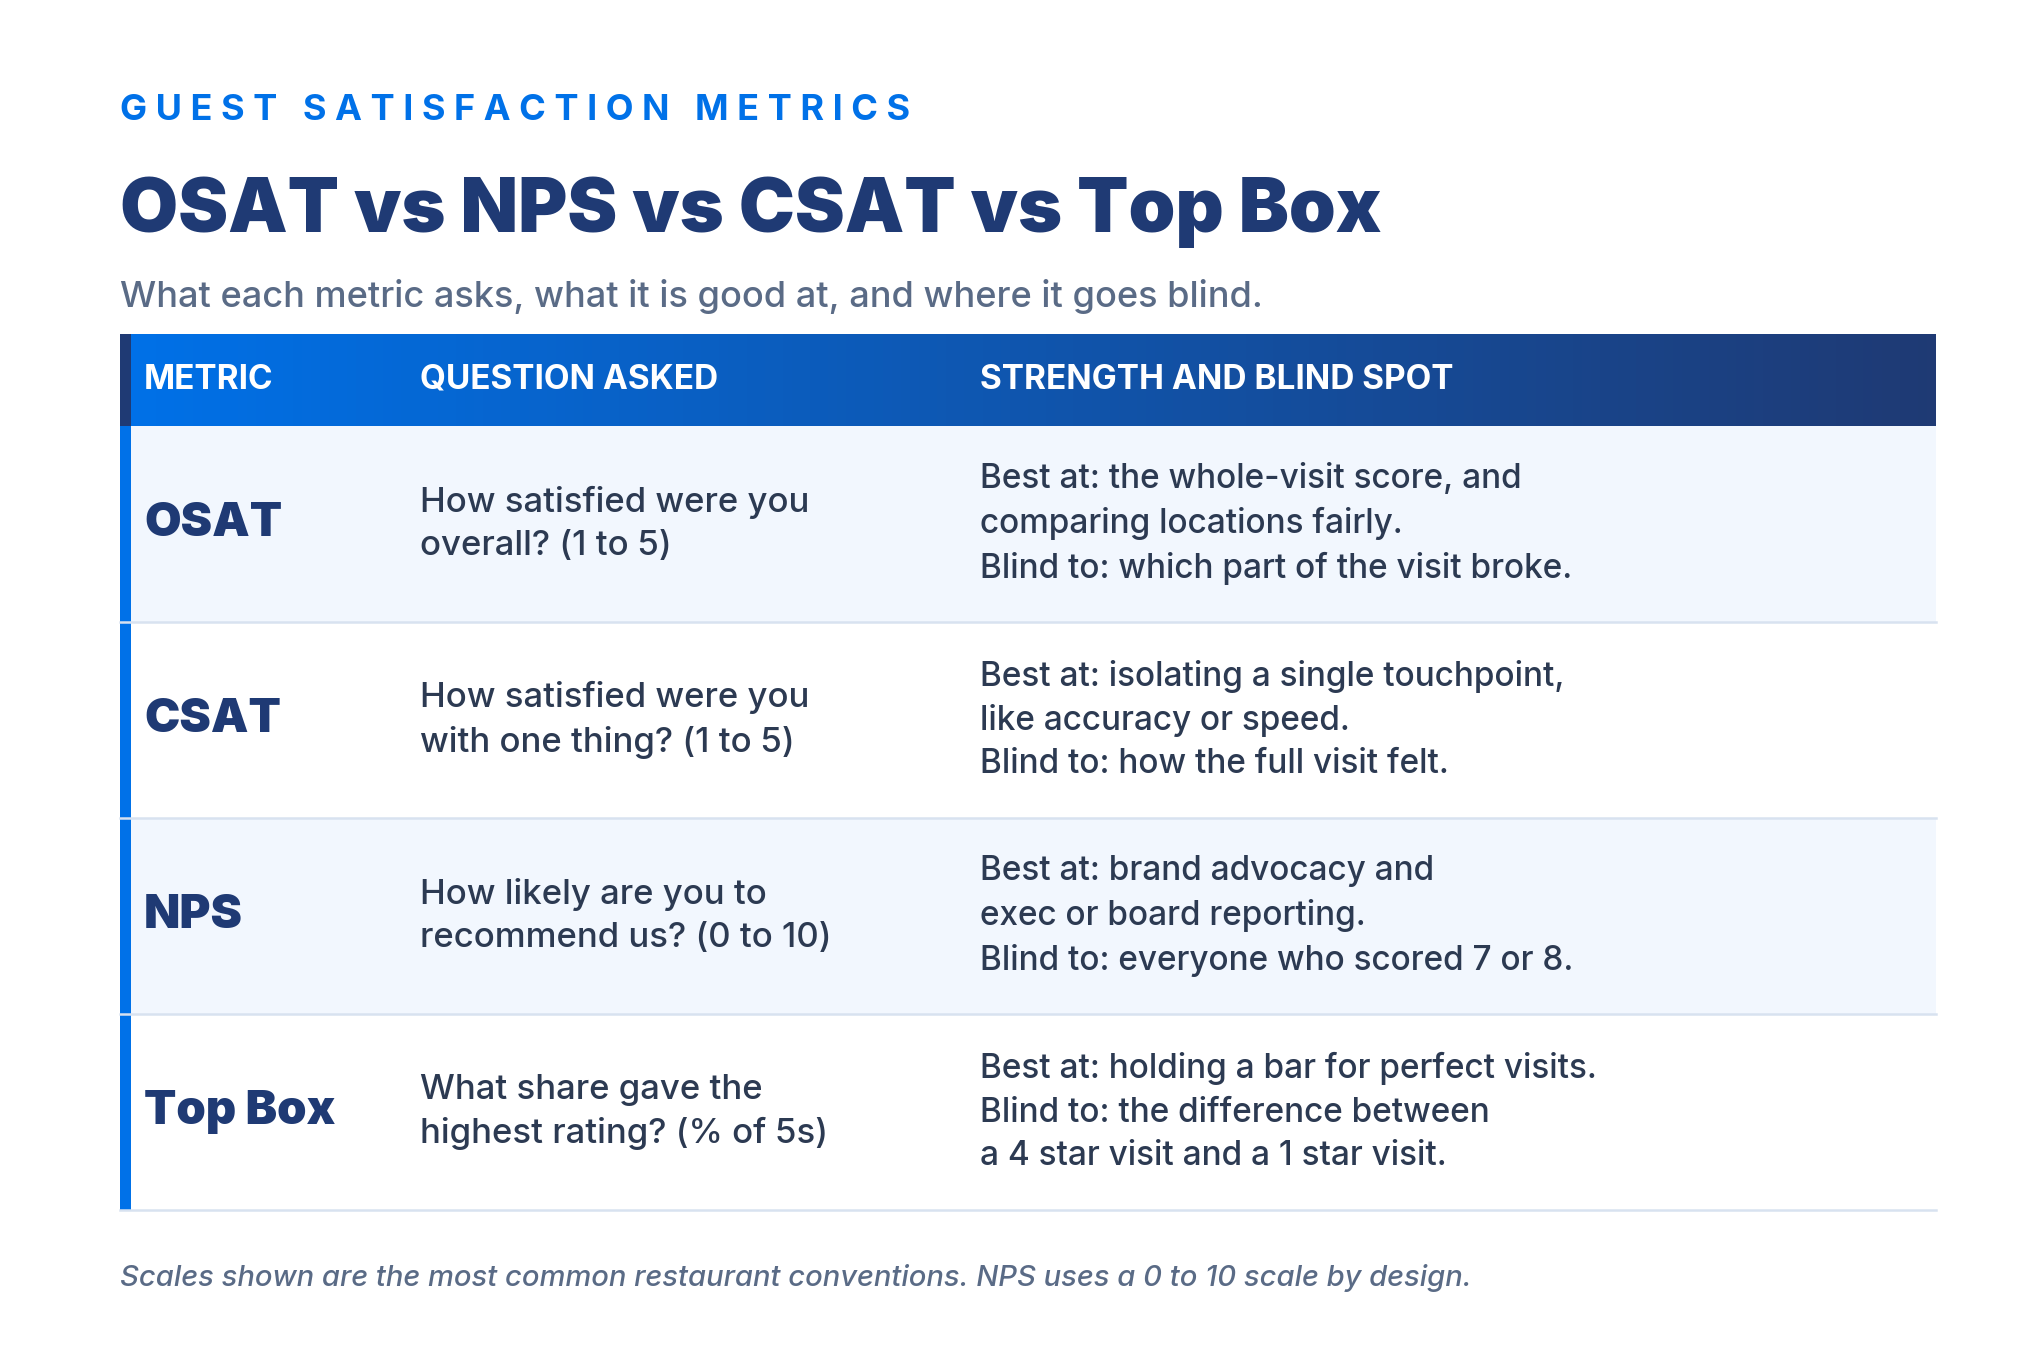
OSAT is the score for the visit as a whole. The survey question is some version of “How satisfied were you with your visit today?” on a 1 to 5 or 1 to 7 scale.
There are two common ways brands report it, and mixing them up is the single most common measurement error we see:
Both are legitimate. They are not comparable to each other, so pick one, write it down, and never let a deck mix them.
CSAT is scoped to a single touchpoint. “How satisfied were you with the accuracy of your order?” is a CSAT question. So is “How satisfied were you with the speed of service?”
That narrowness is the point. In the CSAT vs NPS comparison, CSAT is the diagnostic metric and NPS is the headline metric. CSAT tells you the drive-thru window is where your 2-star visits come from. NPS cannot tell you that, because it never asked.
NPS asks one question on a 0 to 10 scale: how likely are you to recommend us to a friend or colleague? Guests who answer 9 or 10 are Promoters, 7 or 8 are Passives, and 0 through 6 are Detractors. The score is the percentage of Promoters minus the percentage of Detractors, which puts it on a range from -100 to +100.
NPS was introduced by Fred Reichheld of Bain & Company in the December 2003 Harvard Business Review article “The One Number You Need to Grow,” and it spread further and faster than any CX metric before or since. Its appeal is real: one question, one number, easy to put in front of a board.
Top Box is the percentage of guests who gave the highest available rating, and nothing else counts. On a 5-point scale it is the share of 5s. On a 10-point scale it is usually the share of 9s and 10s.
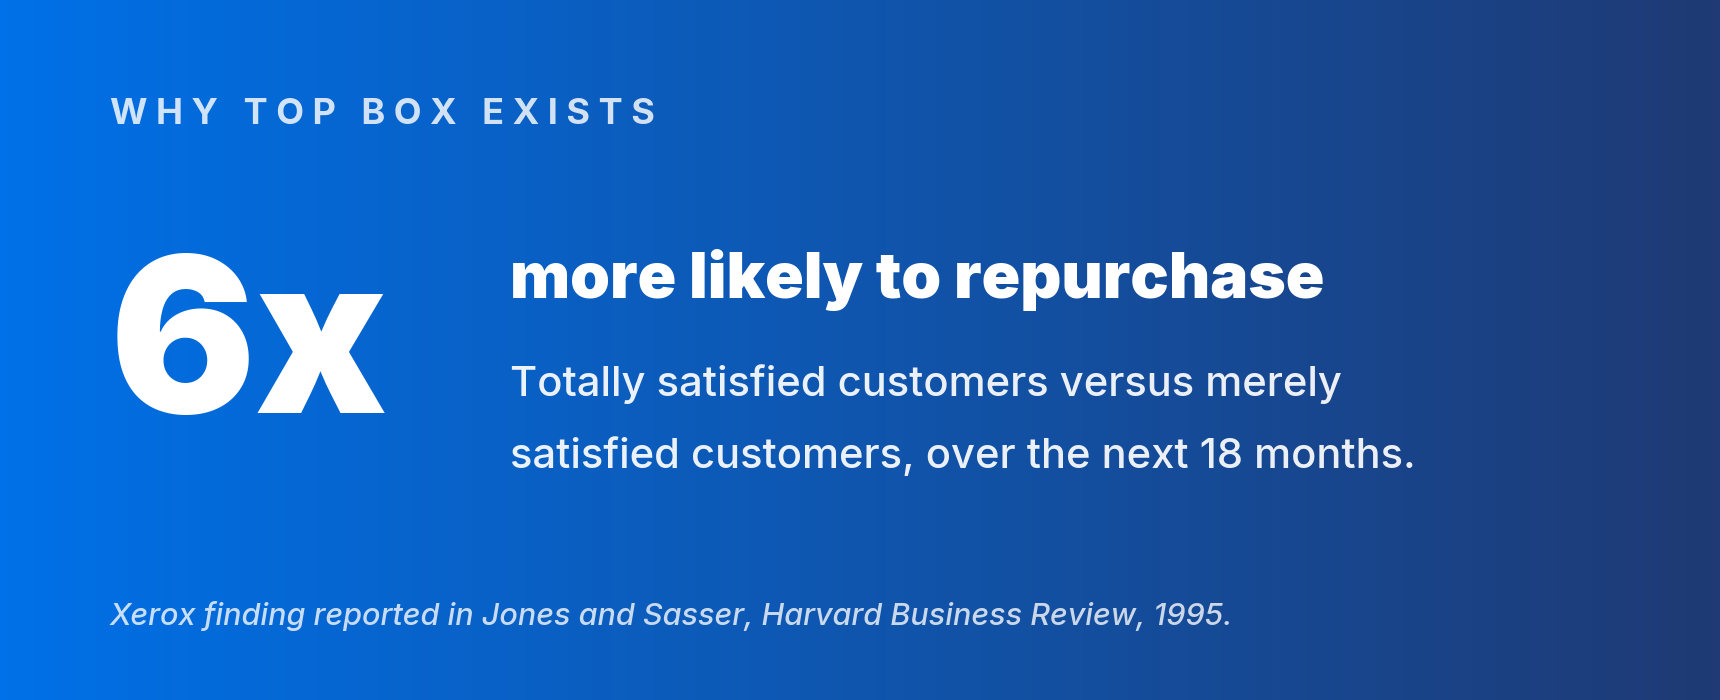
Top Box exists because of a finding that has held up for thirty years. In Harvard Business Review in 1995, Thomas Jones and Earl Sasser reported that Xerox found its totally satisfied customers were six times more likely to repurchase over the next 18 months than its merely satisfied customers. A 4 is not a slightly worse 5. It is a different customer.
Every one of these is arithmetic you can do in a spreadsheet. The formulas:
Take two locations with 100 guest responses each. These numbers are illustrative, not real brand data, and they are the kind of split any multi-unit operator will recognize.
Location A is polarized. On the 1 to 5 satisfaction question: sixty 5s, ten 4s, five 3s, ten 2s, and fifteen 1s. On the 0 to 10 recommend question: sixty answered 9 or 10, ten answered 7 or 8, thirty answered 0 through 6.
Location B is consistent. On satisfaction: forty 5s, forty-five 4s, twelve 3s, two 2s, one 1. On recommend: forty answered 9 or 10, forty-five answered 7 or 8, fifteen answered 0 through 6.
Run the math:
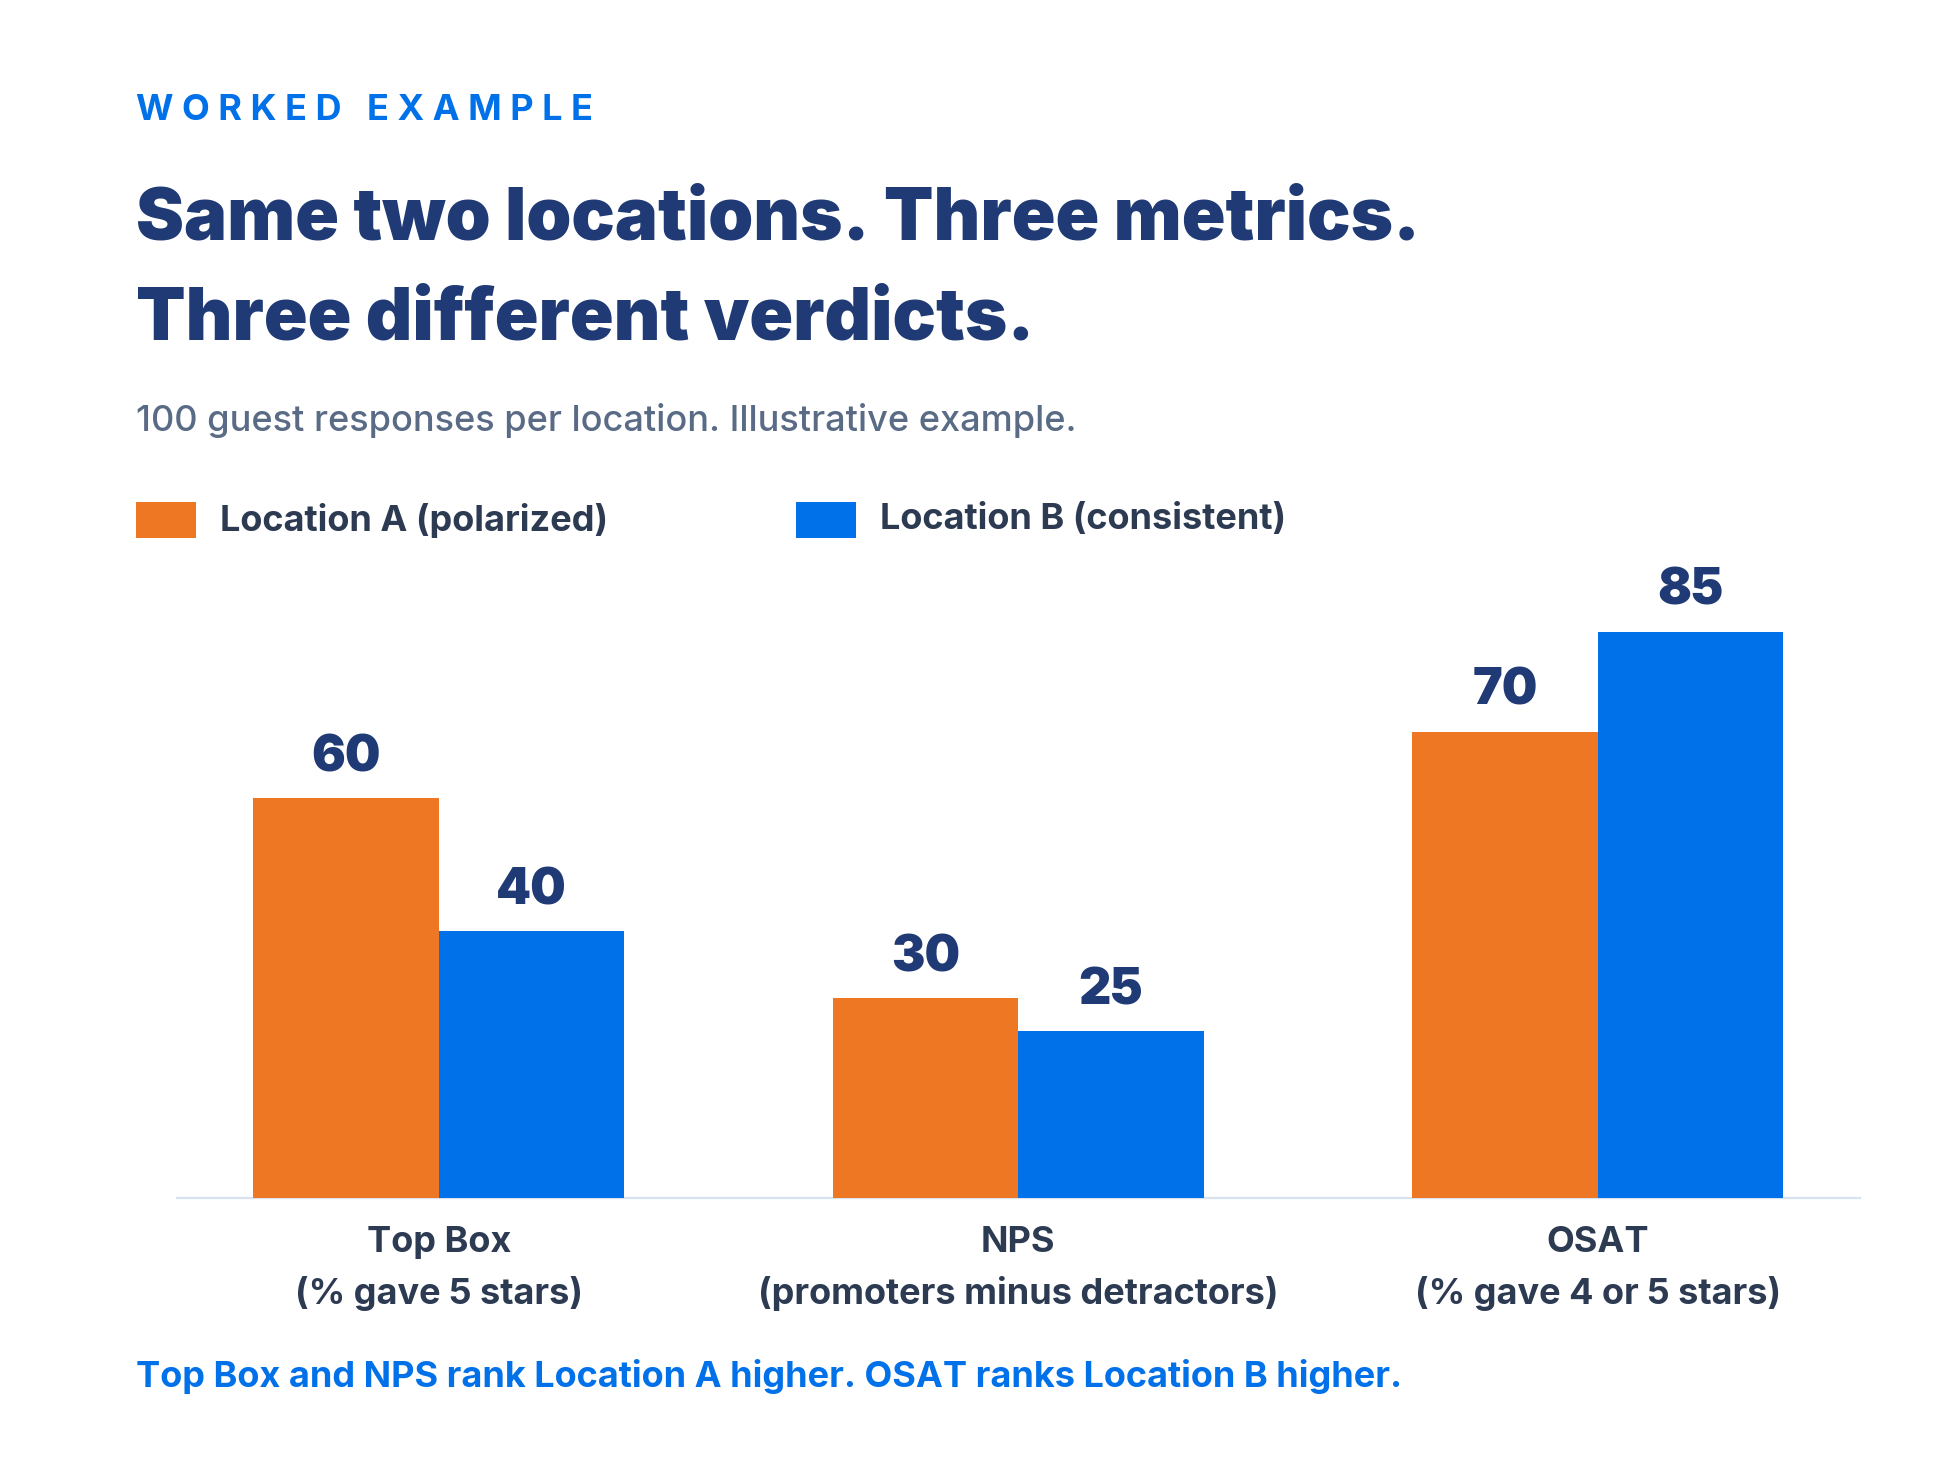
Same guests, same responses, opposite conclusions. Location A produces more perfect visits and more disasters. Location B almost never delights anyone and almost never fails anyone. Which one is your better location is a real strategic question about your brand, and the metric you chose has already answered it for you, whether or not you meant it to.
A metric is not a thermometer. It is an incentive. Whatever you put on the district scorecard is what a GM will optimize on Saturday night, so it is worth being deliberate about the behavior each one produces.
Top Box pushes teams toward peaks. If only 5s count, the rational move is to invest in the guests most likely to have a great visit and stop worrying about the ones who were going to be a 3 anyway. That can be exactly right for a brand whose promise is a standout experience. It also means a location can raise its Top Box score while its 1-star count climbs, because the metric literally cannot see the difference between a 4 and a 1.
NPS pushes teams toward eliminating detractors. Because a Detractor subtracts a full point and a Passive subtracts nothing, the highest-leverage move in an NPS regime is fixing bad visits, not improving good ones. That is often the right instinct in restaurants. The cost is that NPS discards the middle: every guest who scored 7 or 8 is worth precisely zero, so a location that moves a large block of guests from 7 to 8 has done real work and will see no change at all in its score.
OSAT pushes teams toward consistency. Every rating counts proportionally, so moving 3s to 4s shows up. Operators tend to find this the most motivating of the four, because incremental progress is visible within a period rather than a quarter later.
CSAT pushes teams toward a specific fix. Which is why CSAT belongs underneath your headline metric rather than beside it. It answers “what do we do Monday,” not “how are we doing.”
NPS is the most widely used loyalty metric in business, and it is also the most contested, which is worth knowing before you build a bonus structure on it.
The original claim was that Net Promoter is the single best predictor of revenue growth. In 2007, Timothy Keiningham, Bruce Cooil, Tor Wallin Andreassen, and Lerzan Aksoy published “A Longitudinal Examination of Net Promoter and Firm Revenue Growth” in the Journal of Marketing, replicating the original analysis against Norwegian Customer Satisfaction Barometer data and the American Customer Satisfaction Index. They were unable to reproduce the claim of clear superiority over other satisfaction measures in the industries cited as NPS exemplars. The paper won the 2007 Marketing Science Institute / H. Paul Root Award for the most significant contribution to the practice of marketing that year.
This does not make NPS useless. It makes NPS a good relationship metric rather than a magic one. Qualtrics XM Institute frames it the same way: NPS tracks the overall relationship and travels well to a board, but it does not tell you why guests feel the way they do, and it works best as one input in a program that also measures interactions.
The practical read for an operator: use NPS if you want a comparable, well-understood advocacy number for executive reporting. Do not use it as your only metric, and do not expect it to tell a GM what to change.
The most credible public benchmark for U.S. restaurant satisfaction is the American Customer Satisfaction Index, which scored full-service restaurants at 82 and quick-service restaurants at 79 out of 100 in 2026. Food delivery came in at 75. The QSR score has now held at 79 for three consecutive years.
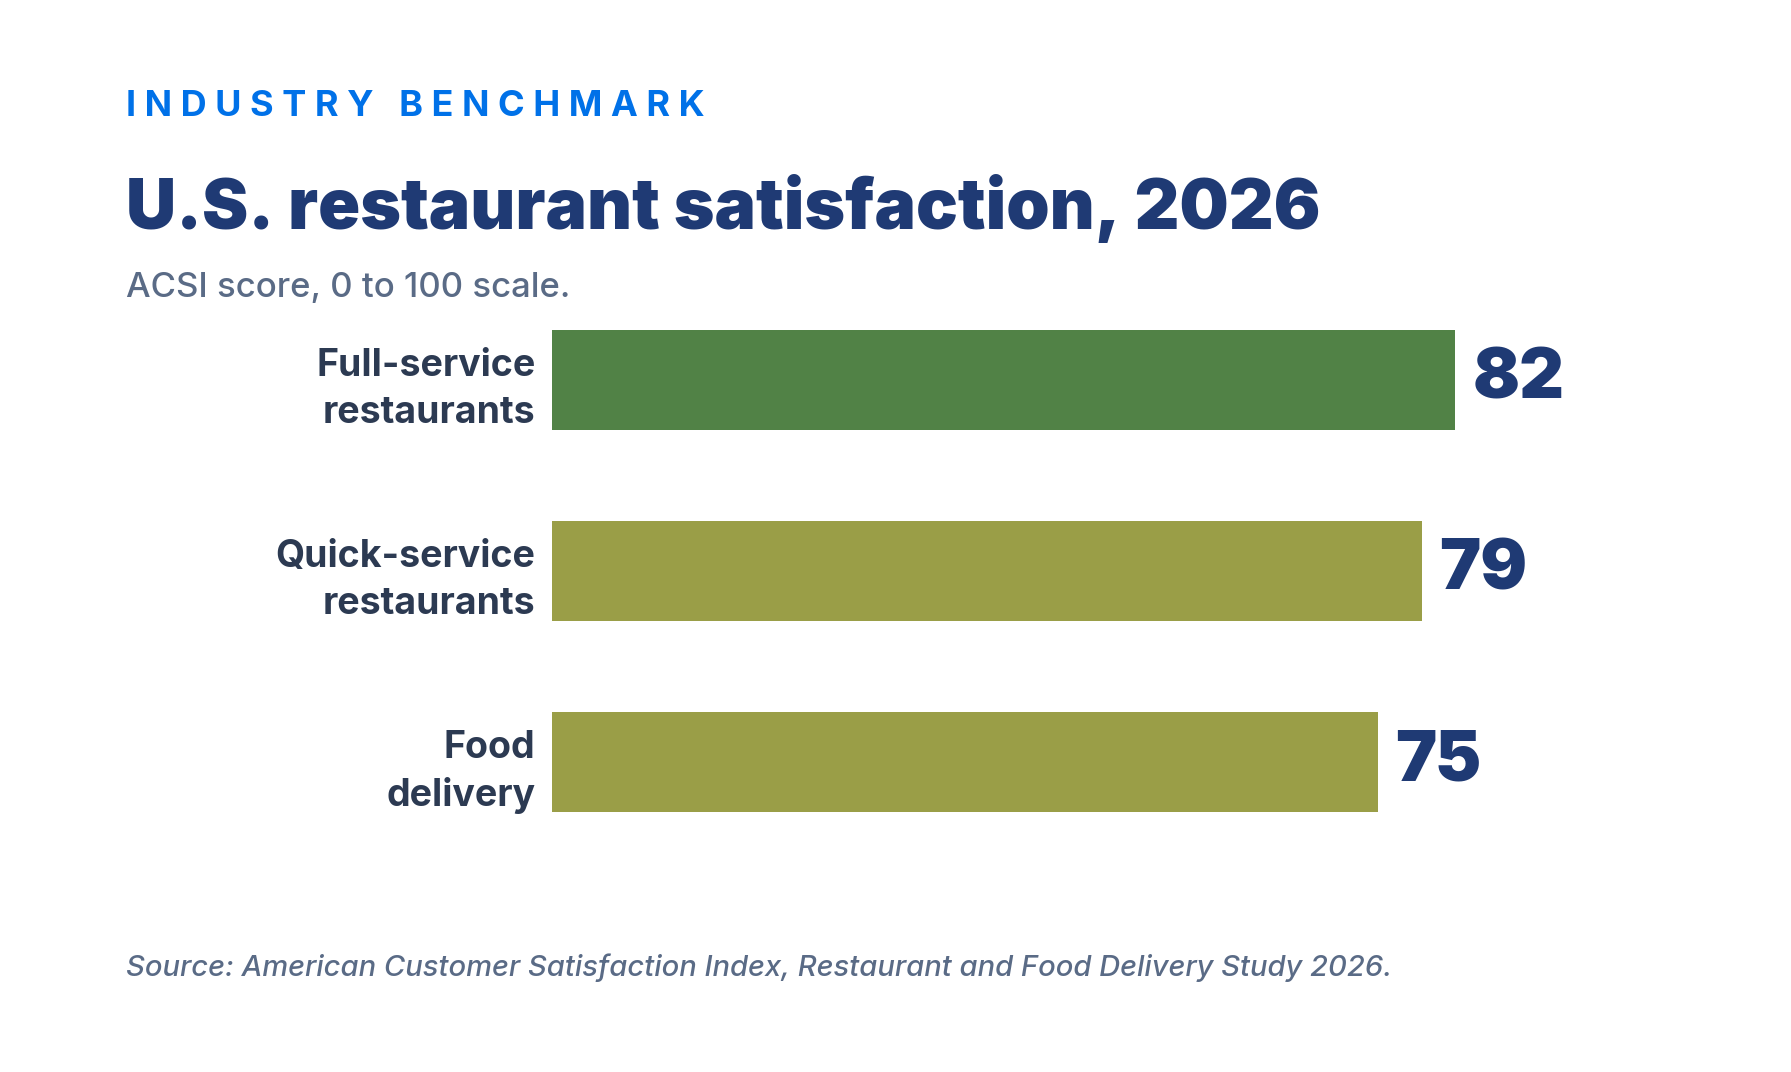
Two things about that data matter more than the headline numbers.
First, the study is large and methodologically public: 16,464 completed surveys collected between April 2025 and March 2026. When you are choosing a benchmark to hold your locations against, provenance is the whole point.
Second, the stability at the industry level is hiding real movement underneath. ACSI reported chain restaurant sales growing about 3% in 2025 against 3.8% menu-price inflation, per Technomic, meaning growth is coming from price rather than traffic. In that environment, what drives satisfaction shifts. Forrest Morgeson, Director of Research Emeritus at the ACSI, put it directly: “Price still matters, but it’s no longer enough on its own. Consistency across the full experience is what separates the leaders right now.”
Consistency is an OSAT idea, not a Top Box idea. If the thing separating winners from losers in 2026 is the absence of bad visits rather than the abundance of perfect ones, a scorecard built entirely on Top Box is measuring the wrong half of the problem.
A note on internal benchmarks: your own numbers are not comparable to ACSI’s, because ACSI uses a modeled 0 to 100 index and a random national sample, while your survey goes to guests who chose to respond after a transaction. Use ACSI to understand direction and category context. Use your own trailing twelve months to set targets.
You need one primary metric and a small set of supporting ones. Five steps:
Tattle is a Customer Experience Improvement platform for multi-unit restaurants. The measurement problem above is most of what the platform exists to solve: not just producing a satisfaction number, but attaching it to the operational cause so a specific location knows what to change this month.
Three pieces map directly onto the framework in this guide.
Causation-based surveys give you OSAT and CSAT from the same guest, in one survey. Tattle’s surveys are built to isolate why satisfaction moved, across operational categories like food quality, speed, accuracy, and hospitality, rather than only capturing a rating. That means the overall score and the touchpoint diagnostics come from the same response set, so the “what do we fix Monday” answer is already in the data instead of requiring a second study.
Customer Experience Rating (CER) is Tattle’s headline satisfaction metric, and it is an average-based measure by design. CER is the average rating across all responses, which puts it in the same family as OSAT-as-an-average and makes it directly comparable to the star rating guests already see on Google and Yelp. Tattle has written about the tradeoffs between CER, NPS, and Top Box in more detail, including why an average-based score tends to be easier for location teams to set goals against.
Smart Insights and Monthly Objectives turn the score into one assignment per location. Smart Insights tracks operational performance metrics and lets you benchmark units, groups, channels, day-parts, and menu items against each other. Objectives then narrow that to the single highest-impact area for each location each month, which is the part most brands are missing: a metric that has been reduced to one instruction a GM can act on. For coaching that assignment through to a team, AI Coach converts each location’s feedback into prioritized action items, and Guest Recovery surfaces unhappy guests in real time so a bad visit can be addressed before it becomes a public review.
OSAT measures how satisfied a guest was with their visit, while NPS measures how likely that guest is to recommend you to someone else. OSAT uses a satisfaction scale, usually 1 to 5, and counts every response proportionally. NPS uses a 0 to 10 recommendation scale and counts only 9s and 10s as positive while treating 7s and 8s as worth nothing.
CSAT is better for diagnosing a specific problem, and NPS is better for reporting overall brand health. CSAT is scoped to one touchpoint, like order accuracy or speed of service, so it points at a fix. Most multi-unit brands run a relationship metric for executive reporting and CSAT questions underneath it for operations.
No single guest satisfaction metric has been shown to reliably outperform the others at predicting revenue growth. A 2007 Journal of Marketing study by Keiningham and colleagues was unable to replicate the claim that Net Promoter is a clearly superior predictor of growth compared with other satisfaction measures. The more useful question is which metric your teams will act on.
The American Customer Satisfaction Index scored U.S. full-service restaurants at 82 and quick-service restaurants at 79 out of 100 in 2026, with food delivery at 75. Those are modeled index scores from a national random sample, so use them for category context rather than comparing your internal survey average directly against them.
Yes, and most established programs do, but only one should be the primary metric on your scorecard. Adding a recommendation question and a few touchpoint questions to an existing satisfaction survey costs a guest a few extra seconds. The risk is not survey length, it is that having four headline numbers lets every team choose the one that flatters them.
Top Box counts only the highest rating on the scale, so every other response is treated identically regardless of how negative it was. That is deliberate: the metric exists to hold a bar for perfect experiences, based on research showing that totally satisfied customers behave very differently from merely satisfied ones. The tradeoff is that a location’s Top Box score can improve while its share of 1-star visits also grows.
Tattle collects guest feedback across dine-in, drive-thru, pickup, and delivery, reports a Customer Experience Rating as its headline satisfaction score, and ties every response back to the operational category that caused it. Smart Insights lets brands benchmark locations, channels, day-parts, and menu items against each other, and Monthly Objectives reduce that analysis to one focus area per location per month.
Pick one primary metric, define exactly how it is calculated, and make sure something underneath it can tell a GM what to fix. The OSAT vs NPS question matters far less than whether your number is attached to a cause. A satisfaction score that nobody can act on is a report, not a program.
If you want to see what it looks like when the score and the cause live in the same place, book a demo with Tattle.