Insights & Updates
Latest from Tattle
Discover trends, tips, and insights to elevate your restaurant operations.
Discover trends, tips, and insights to elevate your restaurant operations.

Restaurant brands love larger basket sizes (i.e. the number of items attached to a ticket).
But then again, what brand wouldn’t love more revenue per order?
However, there’s more to basket size than just revenue. In fact, it goes far beyond revenue to a place where most restaurant operators likely aren’t familiar with.
When we took a look at the correlation between basket size and accuracy for one of Tattle’s partners (a 100+ location full service brand), we noticed something interesting:
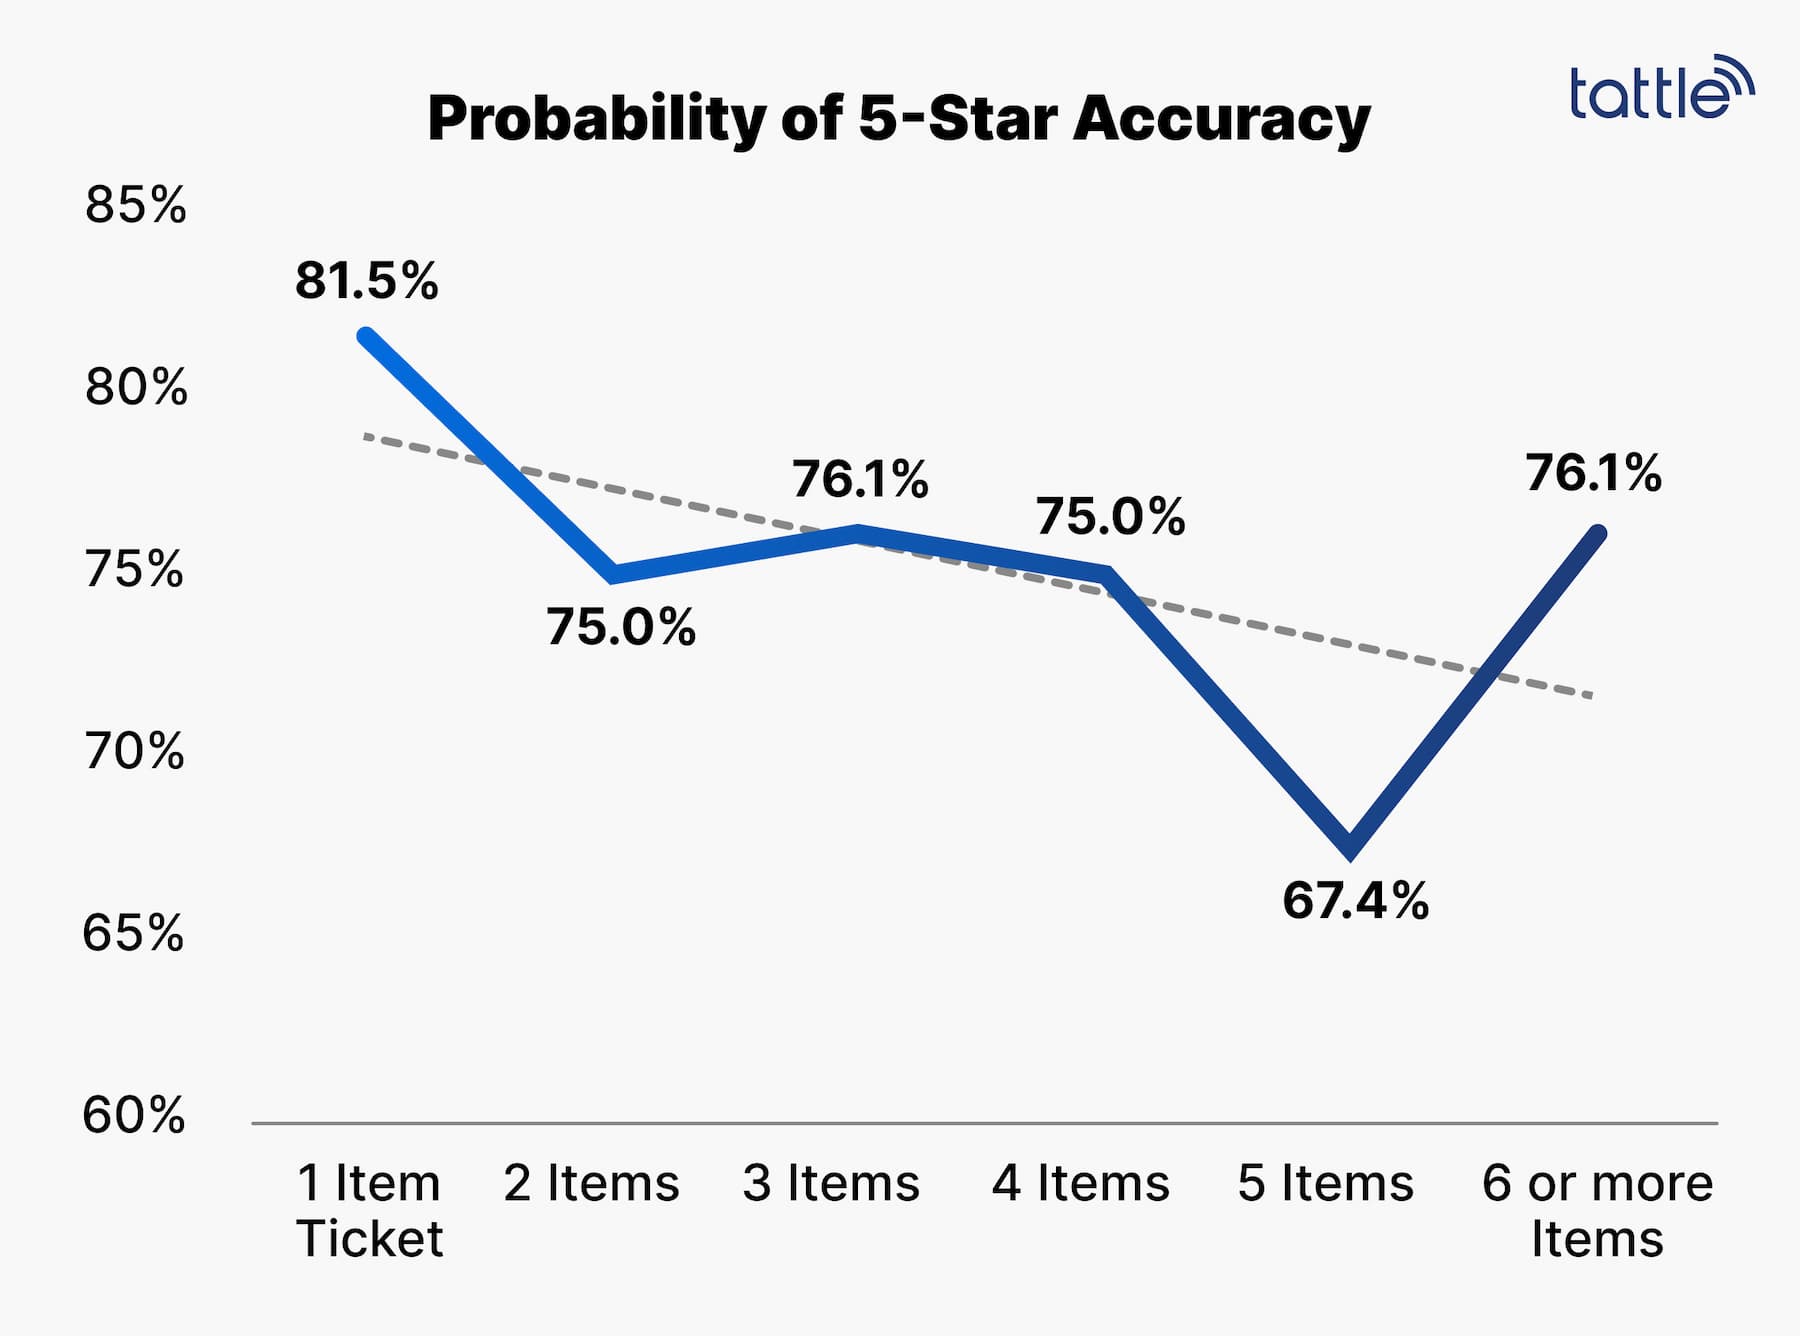
As the basket size increases, accuracy goes down — that is, until the basket size reaches 6 items, when accuracy begins to improve again.
Interestingly, this is not unique to that particular brand at all. A similar pattern shows across the board in the restaurant industry.
Why is that the case? And what does this mean for your operations?
Before we dive deeper into the analysis, one important distinction to note is that “perceived” accuracy is what’s measured by Tattle.
This is the accuracy of an order from the guest’s perspective, not accuracy in regard to perfect adherence to brand standards. This is because a guest might think that the portion is too small, or the toppings too light, or the fries too soggy – even when an item is executed to perfection by brand standards.
At the end of the day, it’s the guest’s perception and satisfaction that influences their likelihood to return.
Now, onto the analysis.
When the basket size is only one item, the probability of having inaccuracies is relatively low. However, with every item added to the ticket, the probability of the guest seeing the order as accurate and speedy reduces by 1.5%.
Interestingly, when the basket size reaches 6 items, the accuracy score goes up. This is because most restaurants will likely have an additional step to double check that the larger orders have everything included. Sometimes, larger orders even need managerial approval before leaving the door.
As a result, basket sizes of 2-4 items (upward of a ~6% reduction in accuracy) tend to be the most problematic.
Once you’ve conducted a similar analysis for your brand, you can isolate the basket sizes that tend to suffer the most from order inaccuracy. In our example, it’s basket sizes ranging from two to four.
Now you’d want to take a closer look at the two to four-item tickets, and see which items are the most commonly included in those, and what are the most typical attachments to the hero product. You’ll obtain a chart similar to the one below.
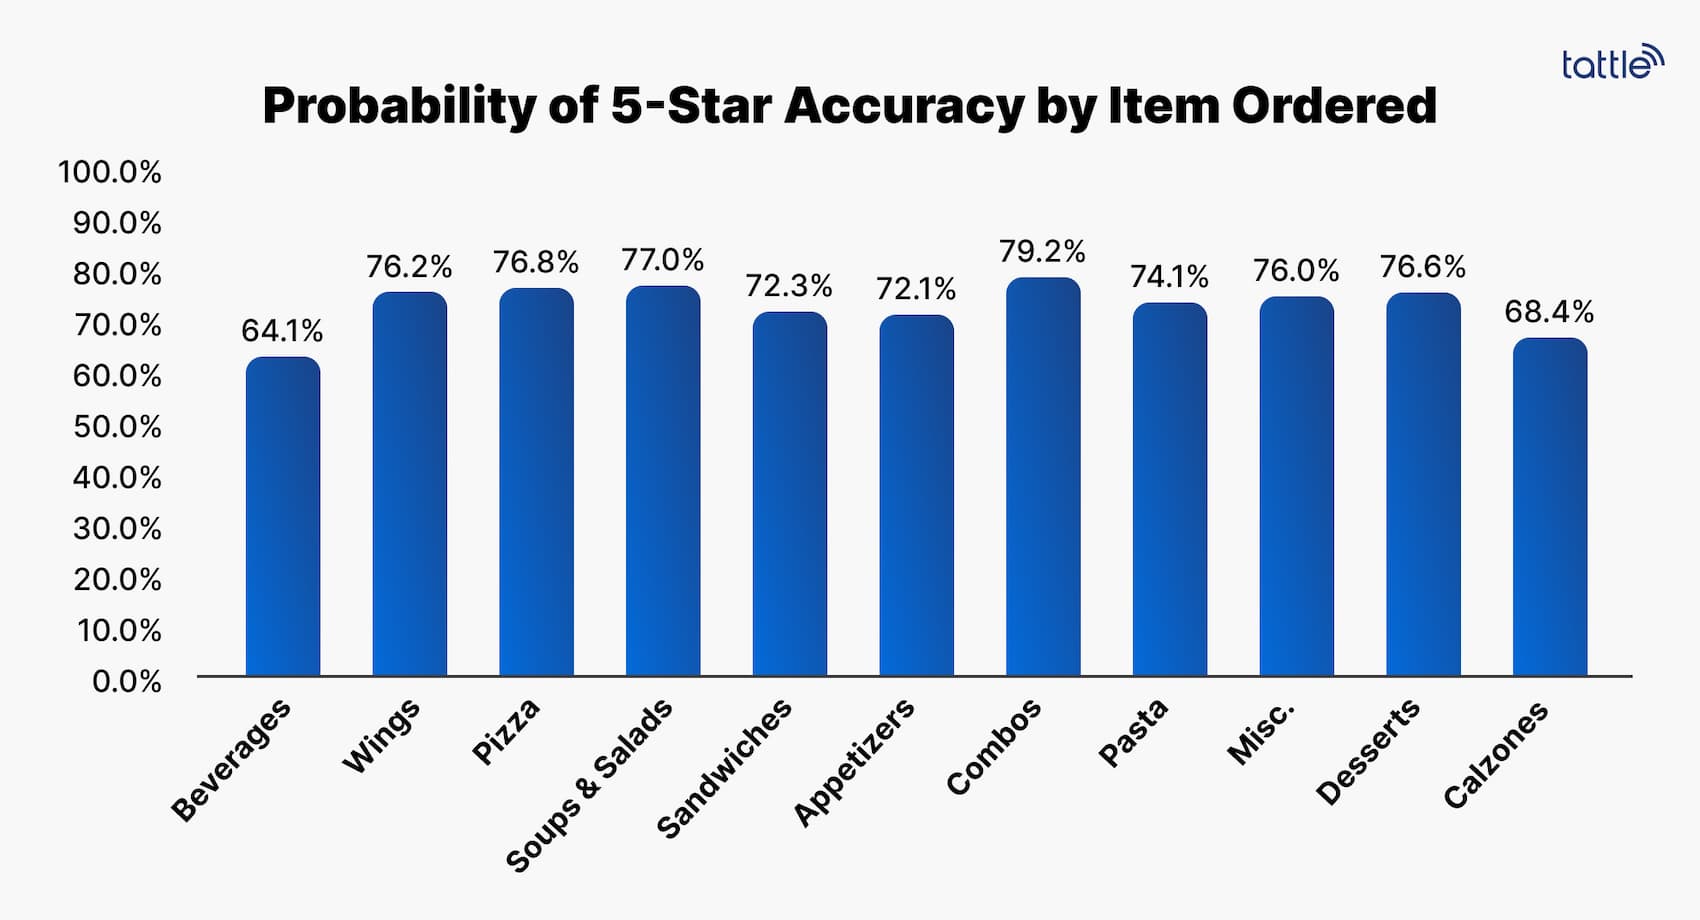
As you can see, beverages tend to have the lowest accuracy ratings.
To improve, a brand may start by asking questions about where beverages are staged across its locations. Are beverages easily accessible by the staff? Are there ways to change the layout, environment, and protocols to minimize human error and maximize speed?
In this real-life scenario, the reason for the low beverage accuracy rating was due to the beverage fridge being close to the pickup shelf. Dine-in customers could easily grab the drink themselves before paying at the counter, but delivery and takeout orders required staff members to walk around the counter, to the fridge, and grab the drink for the order. As a result of this inefficiency, order accuracy greatly suffered for off-premise orders.
Upon identifying this operational gap, the brand placed an additional beverage fridge under the counter for easier access by the staff. As expected, their accuracy scores improved almost immediately.
There are two different directions your restaurant brand can go when collecting data behind menu-level order accuracy.
We recommend well-structured surveys that efficiently capture guest sentiment on their overall experience, down to individual menu items.
As for overall experience, you’ll want to ask probing questions about each operational area to get the most clarity. Have guests first provide a rating of the area (e.g. Accuracy, Food Quality, Speed of Service, etc.). Then, drill down and inquire about the factor within each area (e.g. within Food Quality, have guests provide satisfaction for the temperature, texture, or taste).
And as for individual items, it’s best if you can pull data from your POS, loyalty, or ordering provider and use it to pre-populate your surveys for guests. It allows for a much smoother experience, since they don’t have to order information that you already have. A 1-5 star rating for each item will work perfectly.
Once you have the survey laid out, you’ll want to automate the sends each time a transaction occurs. You can use APIs to connect your tech stack to your survey, ensuring guests who provide their contact info get an email or text containing a link to the survey at a set time after they order.
Finally, using a spreadsheet application, you can pull together all the responses and visualize what needs work and where. You can
Tattle does everything in the option above and much more. You can learn more about how we have helped hundreds of multi-unit restaurant brands (such as Chili’s, Hooters, and MOD Pizza) skyrocket their guest insights and improve operations — automatically.
You can learn more about Tattle's feedback platform.
Want more?
About the Author
Intelligence & Analytics Expert
Alex formerly led Customer Excellence programs at Blaze Pizza and Dunkin'. Now, he oversees LTO testing, operational analysis, and ROI optimization for Tattle partners.