Insights & Updates
Latest from Tattle
Discover trends, tips, and insights to elevate your restaurant operations.
Discover trends, tips, and insights to elevate your restaurant operations.

NPS is a simple metric that measures the perception of a customer to a specific business, product, or service. The score ranges from -100 to +100 and is determined by the results of a single-question survey.
The question is as follows:
“How likely is it that you would recommend \ to a friend or colleague?
It’s a question everyone has seen or heard — and perhaps even responded to. Based on the responses — a scale of 0 (not at all likely) and 10 (extremely likely) — these scores are split into three categories.
In order to calculate NPS, subtract the percentage of Detractors from the percentage of Promoters.
For example, if Detractors made up 10% of the survey results and Promoters made up 70%, the NPS would be 60%.

While NPS has shown its strength as a simplistic metric in the last two decades, the cracks are beginning to be seen in our age of information and technology. In fact, it seems that with every new data-centric customer satisfaction or loyalty tool that comes about, the use cases for NPS continue to diminish.
Here are three problems that loom over the traditional NPS system.
When calculating a singular metric that encompasses the customer experience of tens, hundreds, or thousands of people, we completely mask the nuances in how people rate their satisfaction. So much so that the results can often be misleading.
A single metric can’t paint the picture when someone is satisfied with certain aspects of the experience, but not others. For example, if a customer thinks the drive-thru experience was worthy of a low score, but the food was worthy of a high score, they’re left with no choice but to be stuck in the middle and considered a Detractor.
When, in reality, that label would simply not be true.
Another example would consist of customers who encounter extremely poor customer service at a restaurant, but feel almost compelled to eat there because of the incredibly affordable pricing. These individuals may be Detractors on paper, but they may eat at that establishment every week!
The customer experience has always been multidimensional and the data should reflect that.
When a metric is vague, it carries with it a lack of actionability.
“Huh, we have a 43% NPS. I wonder what we’re doing wrong?” a manager at a restaurant might say. “Could it be our food presentation? Or, maybe it’s our servers? Do we need more training? But, what if the Detractors come mostly from pickup or delivery? Is the wait time too long? Or, you know what, maybe it’s just too chilly in this restaurant?”
As you might imagine, this could go on ad infinitum.
Where do you start? What must be changed first? How can you know anything without consistent, granular data points?
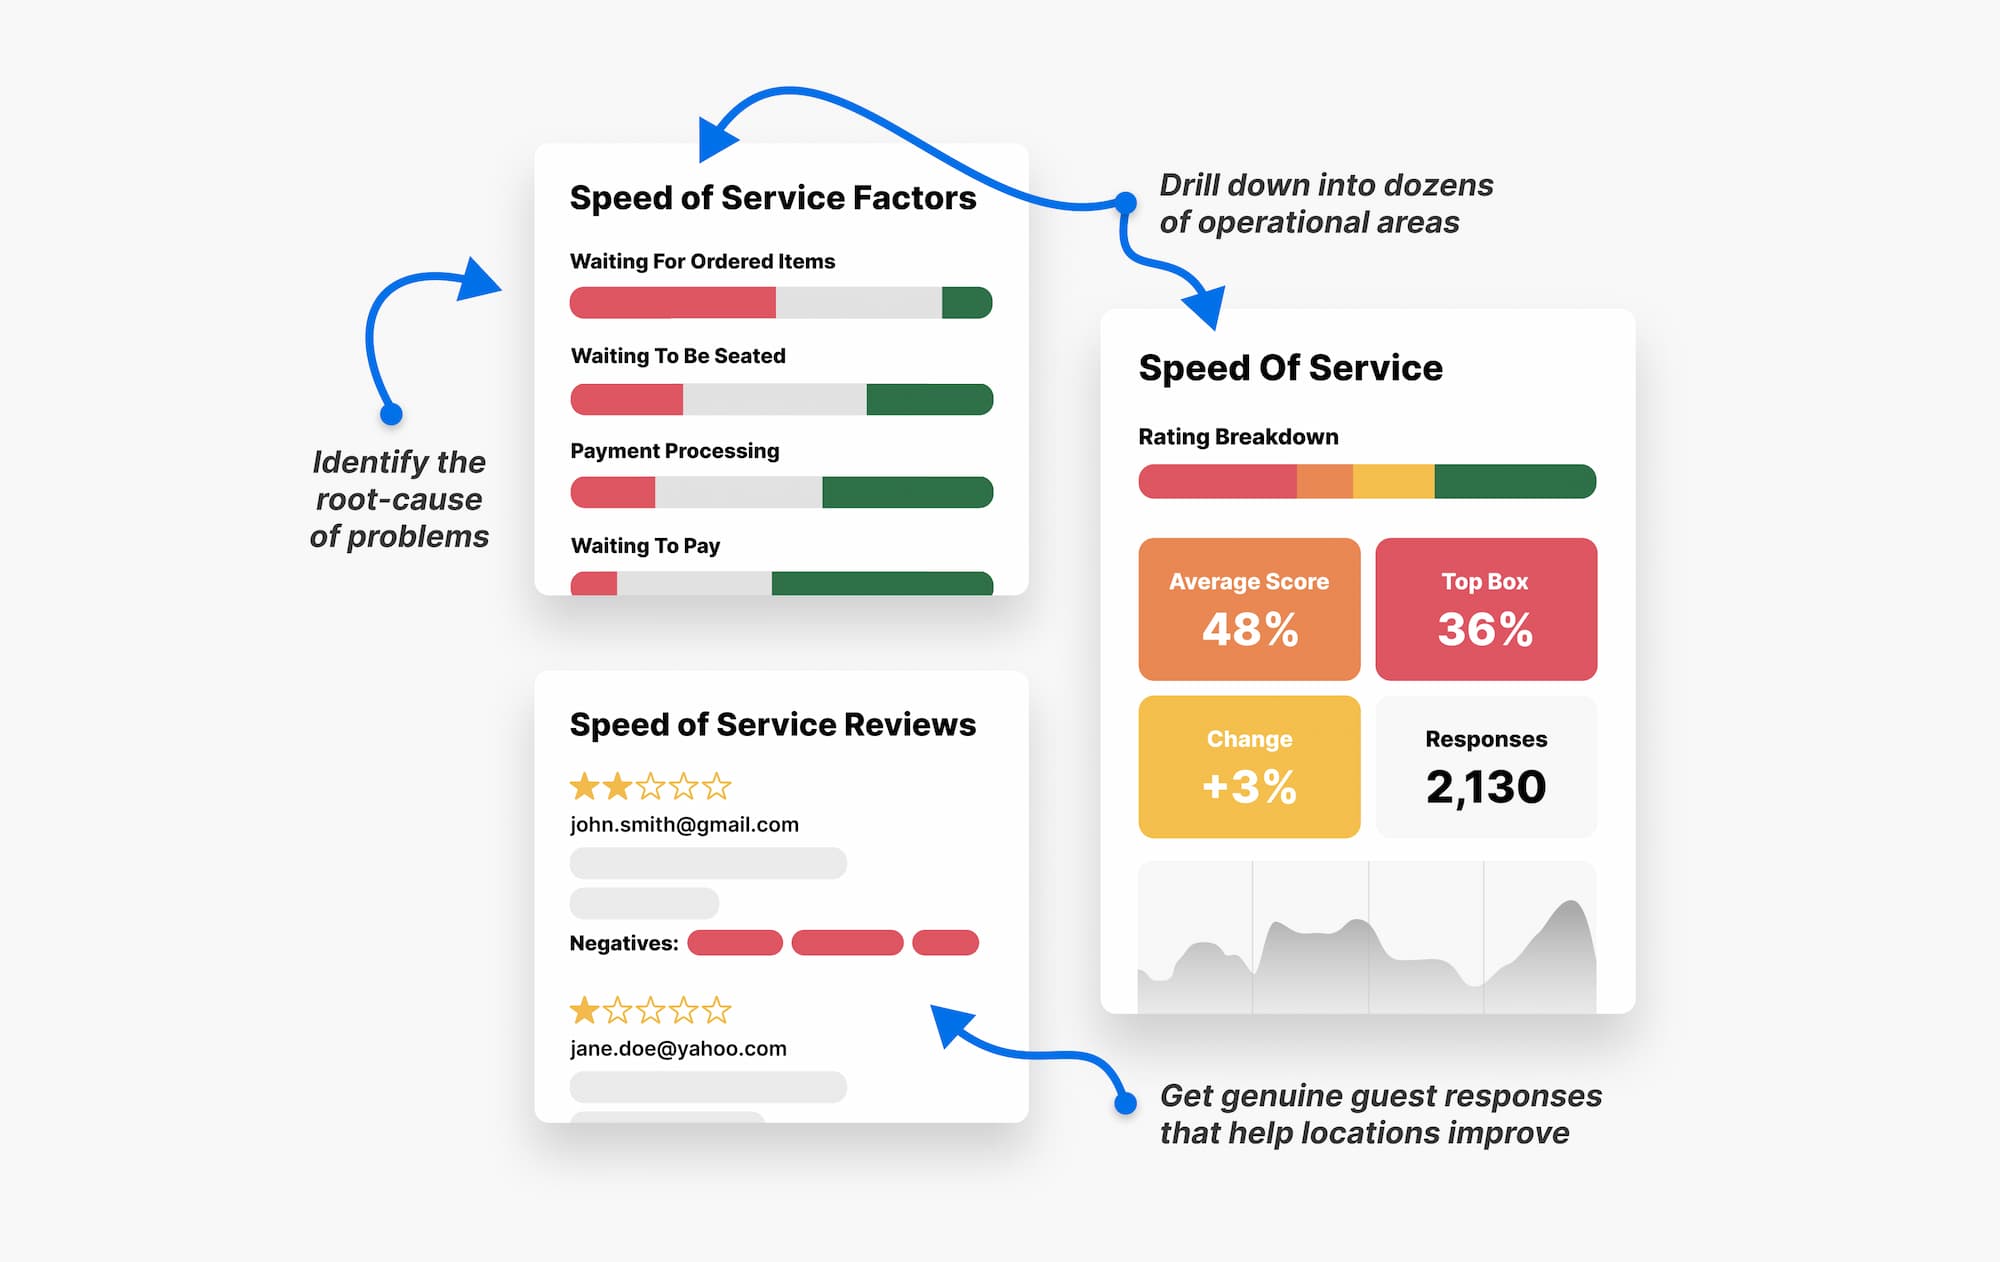
That’s why it’s so important to generate granular, detailed feedback from a single customer. If done correctly, the operational categories that were overlooked or ambiguous might be exposed. Unfortunately, NPS fails to uncover the underlying causes of issues, and only gives you a generic overall rating that your teams can’t act on.
How often do we personally encounter businesses, products, or services that we really love and enjoy, but wish just one small thing could be different?
Quite often — those are the Passives.
When we exclude the entire group of Passives from the final NPS calculation, we eliminate an subset of people who may have extremely relevant and helpful feedback for the success of the customer experience. How many more Promoters could be generated if those scores of 7 and 8 are turned into a 9 or 10?
Passives are the individuals who are closest to being raving fans — they must be heard loud and clear.
This harkens back to the previous point on the inability to take action based on NPS, showing exactly why it’s so important.
While the birth of NPS two decades ago brought us out of the customer experience stone-age and into the 21st century, it cannot hold a candle to the modern world’s growing expectation of granularity and specificity.
That’s where Tattle is changing the game.
NPS is like a thermometer. A doctor can use it to achieve a high-level gauge of your overall temperature, but nothing more.
But Tattle is like a doctor, having access to far more than a mere thermometer and using the many tools at his disposal to pinpoint problems and prescribe a remedy.
So, how does Tattle do it?
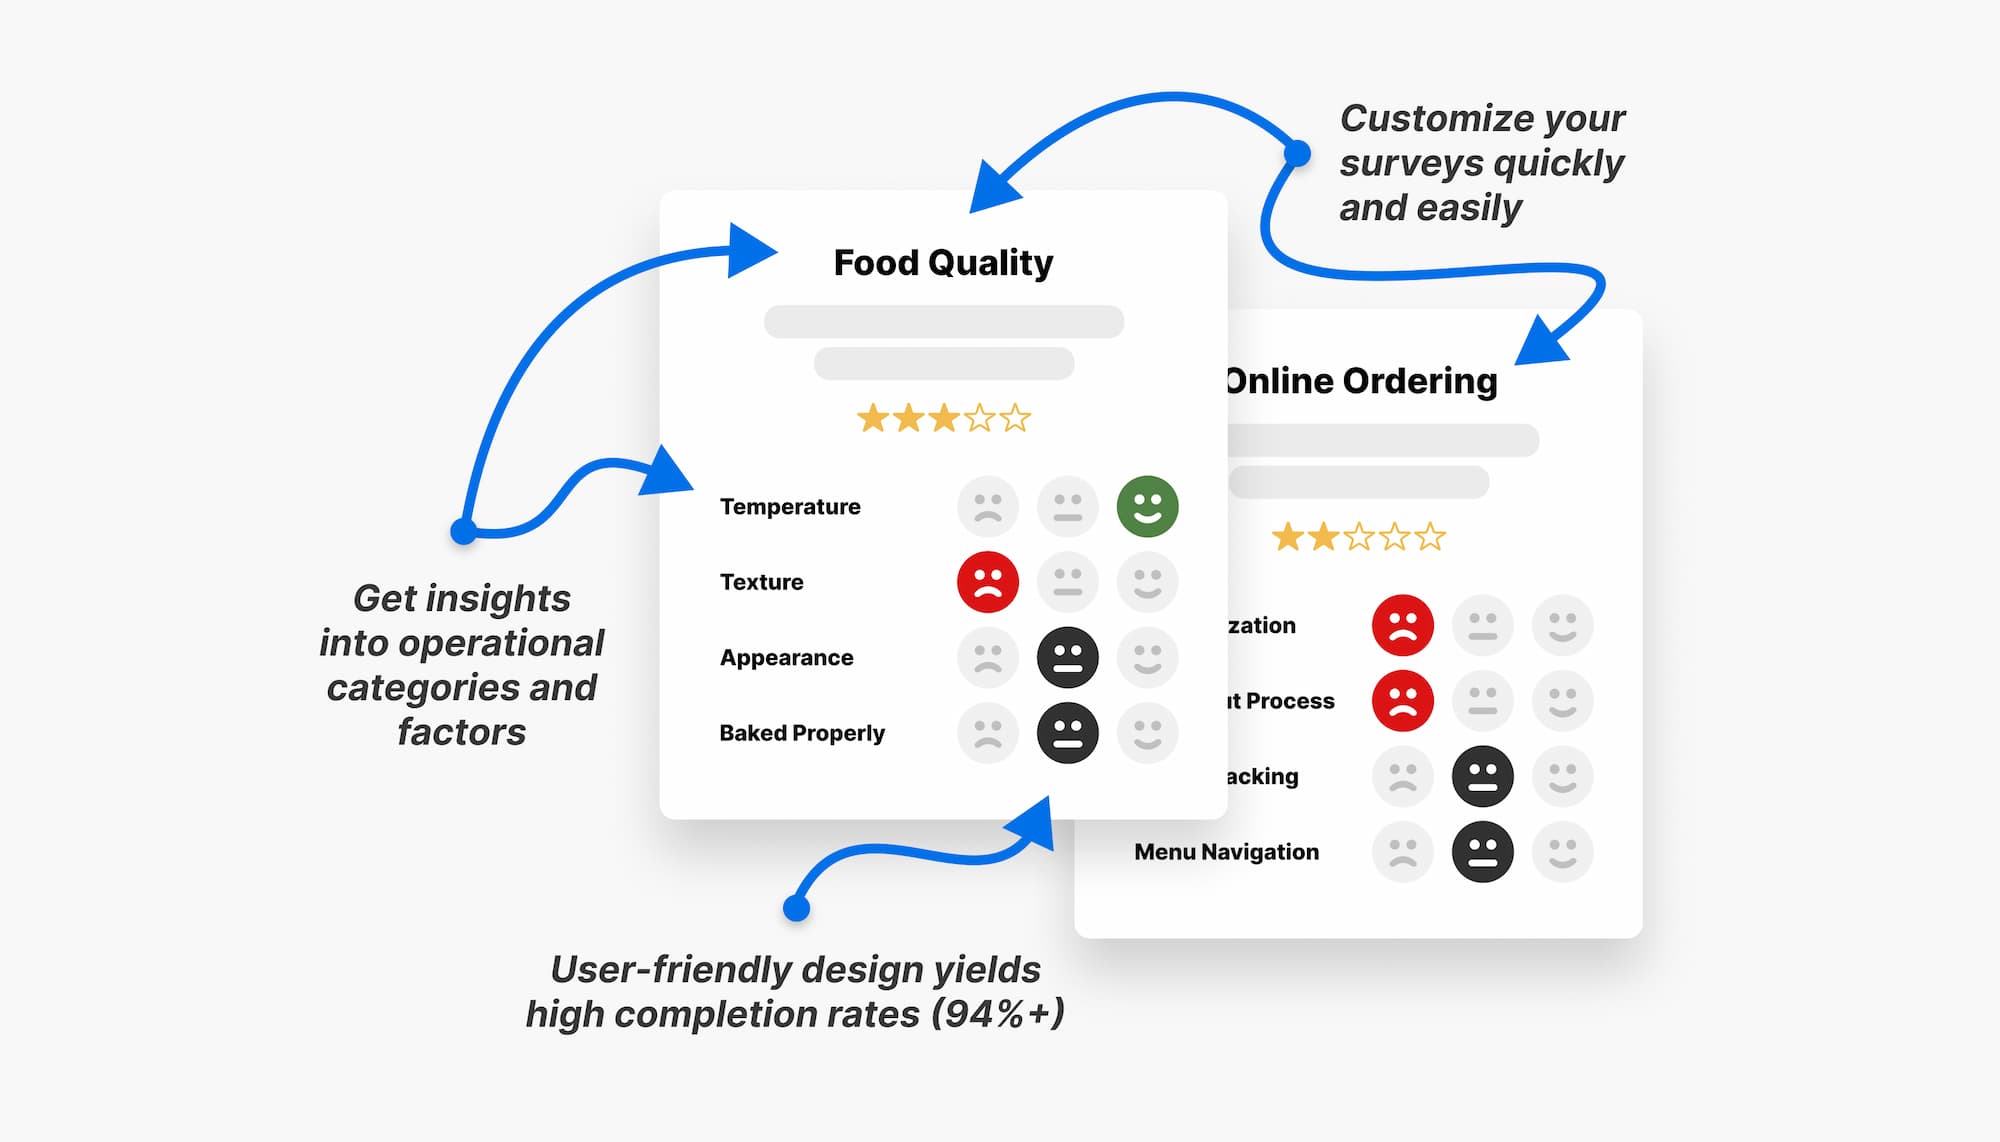
It starts with a battle-tested, causation-based survey design that collects a whopping 55+ data points per survey submission, breaking down traditionally ambiguous operational categories into contributing factors (such as whether a bad “Food Quality” score is due to temperature, texture, presentation, or more).
Despite the granularity and numerous questions, Tattle surveys on average achieve a 94% completion rate and 10% survey participation rate due to its intuitive, user-friendly design — far above any industry average metric.
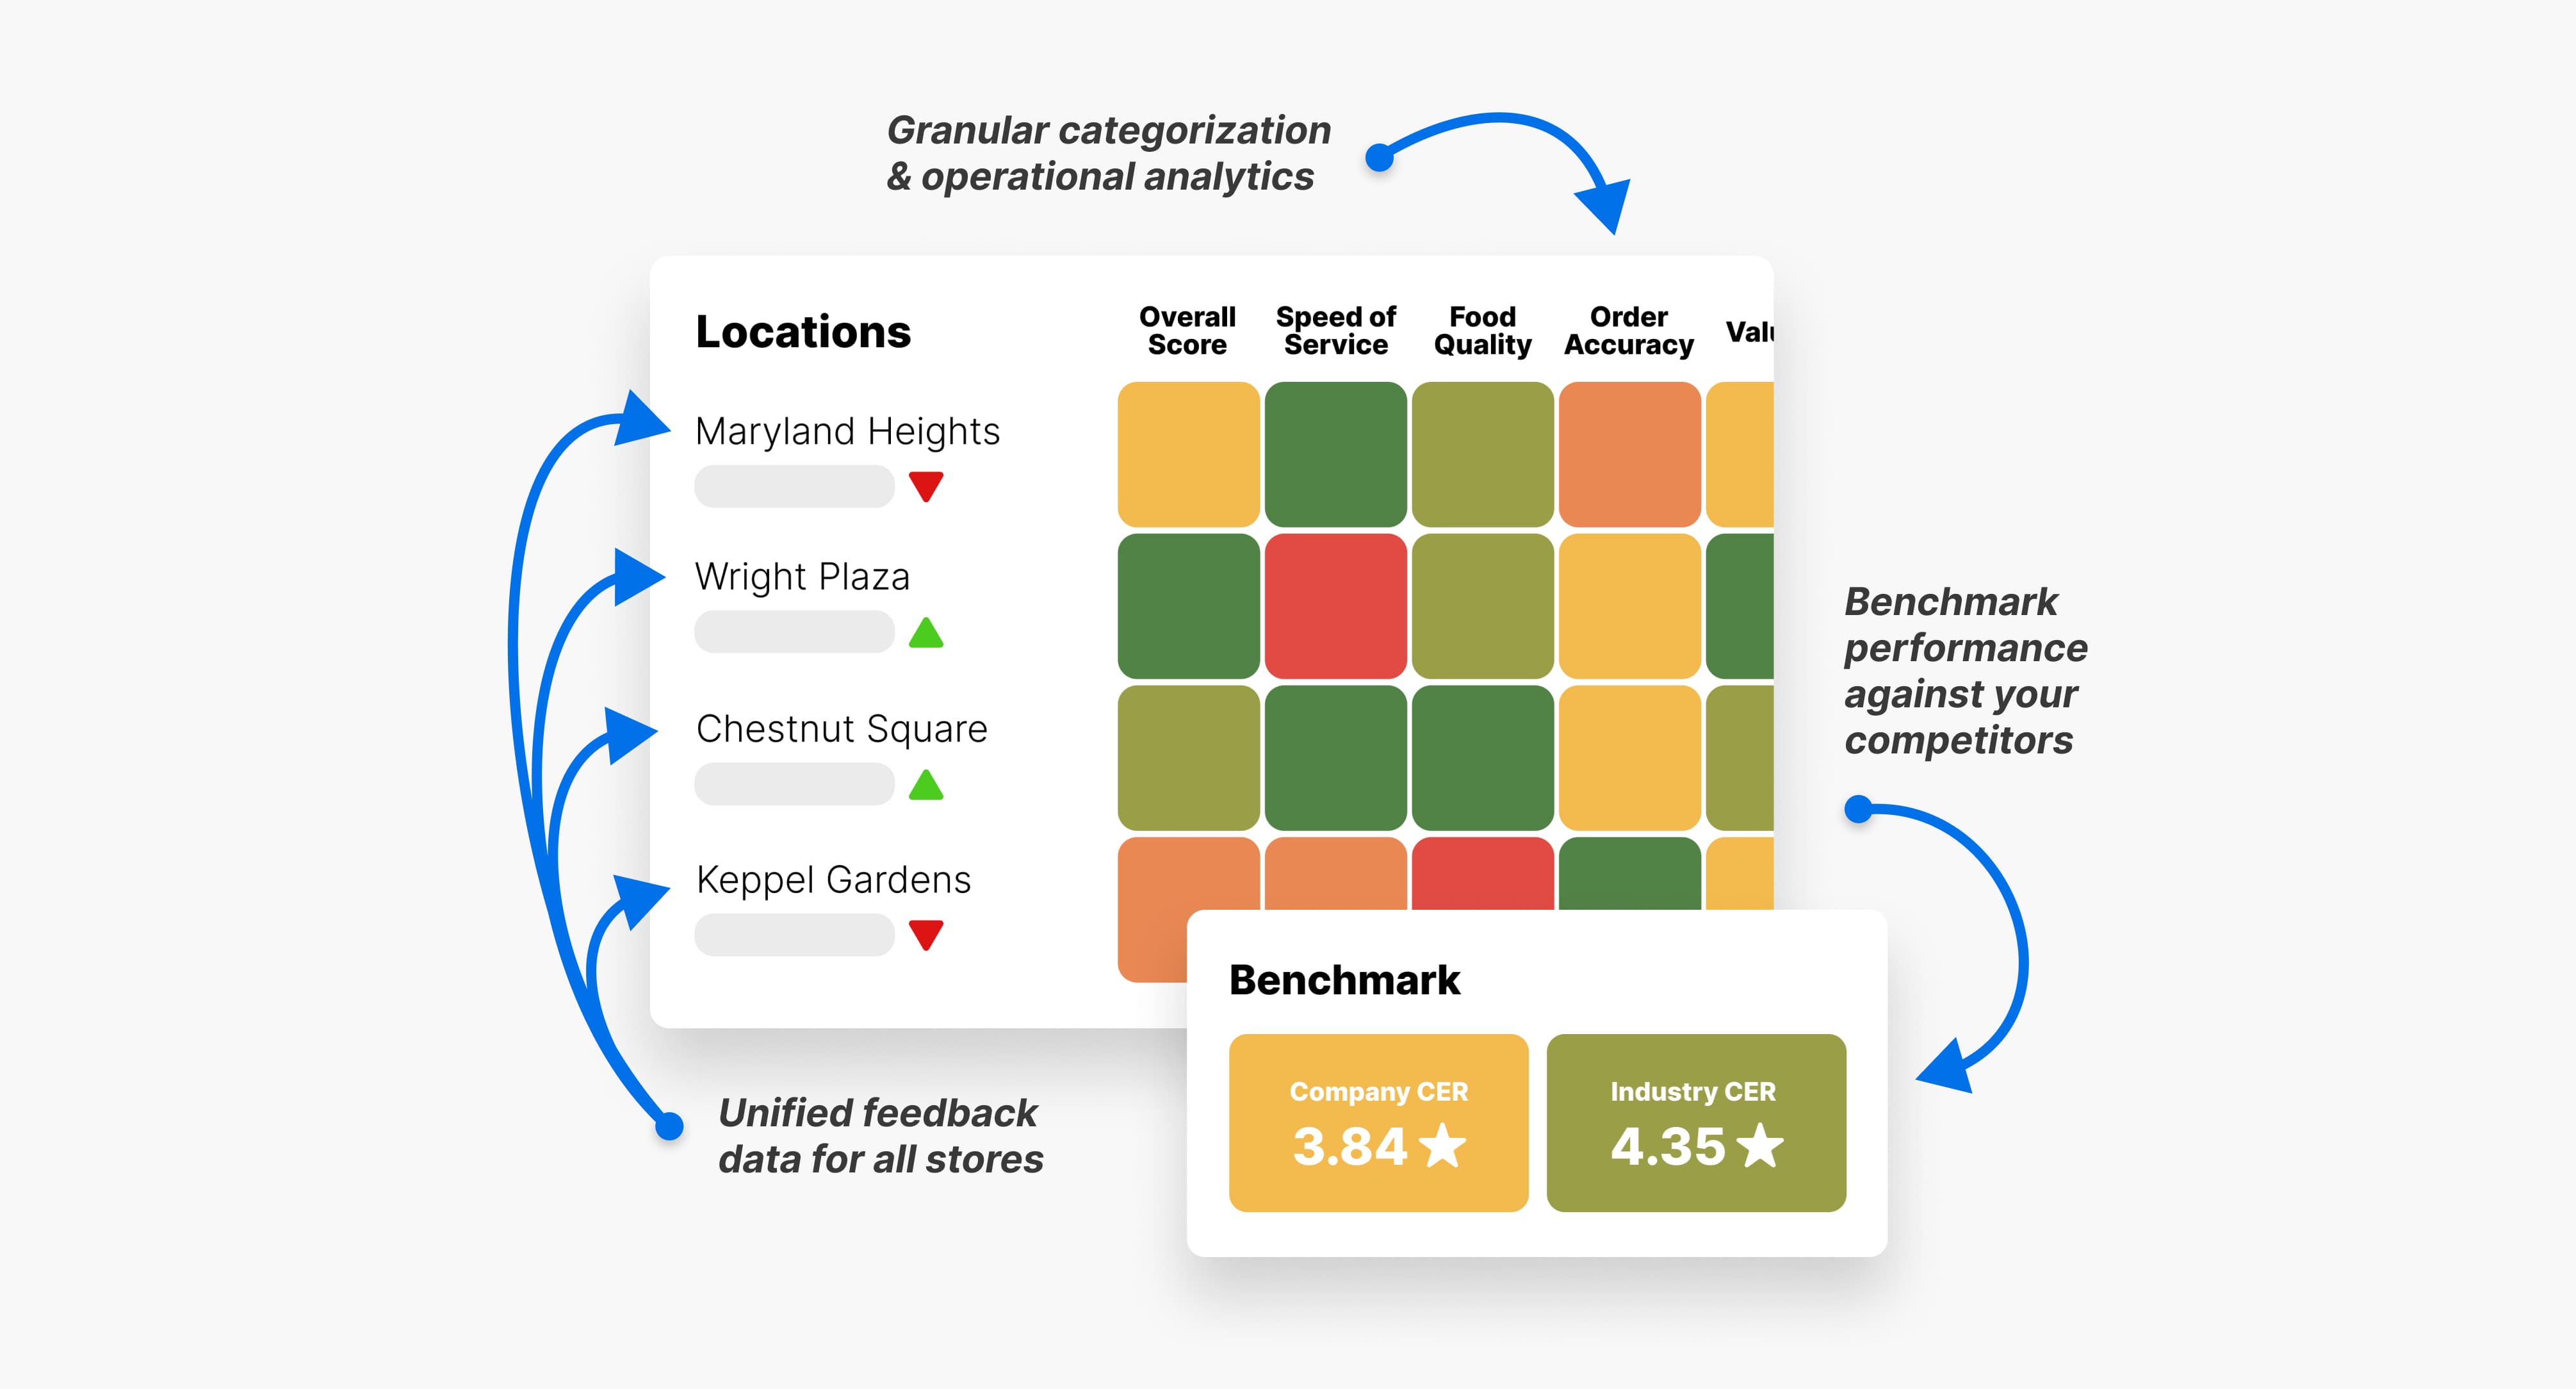
Ultimately, Tattle measures the performance of over 50 operational categories, organizing it all into an interactive dashboard and generating location-level improvement recommendations using AI.
On the front-end, Tattle provides a survey that is both intuitive and well-incentivized for the guest.
Before the customer begins to fill out the survey, they will first be alerted to a reward for completion – whether that be a free side item, discount, or anything else their location might like to provide (Fun fact: Per Tattle data, only 4% of rewards provided are ever actually redeemed. So, don’t hesitate to incentivize!)
This incentive does two things:
When taking the survey, it presents a single question at a time in a clear and concise way. Despite the length of the survey, it never once feels overwhelming, especially with the incentive being at the forefront of one’s mind.
By this survey formula, Tattle has been able to obtain tens of millions of actionable surveys each year for partners.
With 50+ data points on virtually every measurable operational category, the guesswork is eliminated almost entirely.
Gone are the days when district managers or general managers have to ask the following questions:
“Why is X location performing better than Y location?”
“How are the wait times for delivery? Sit-down? Pickup?”
“Which servers are performing well? Which are not?”
“How can we improve right now?”
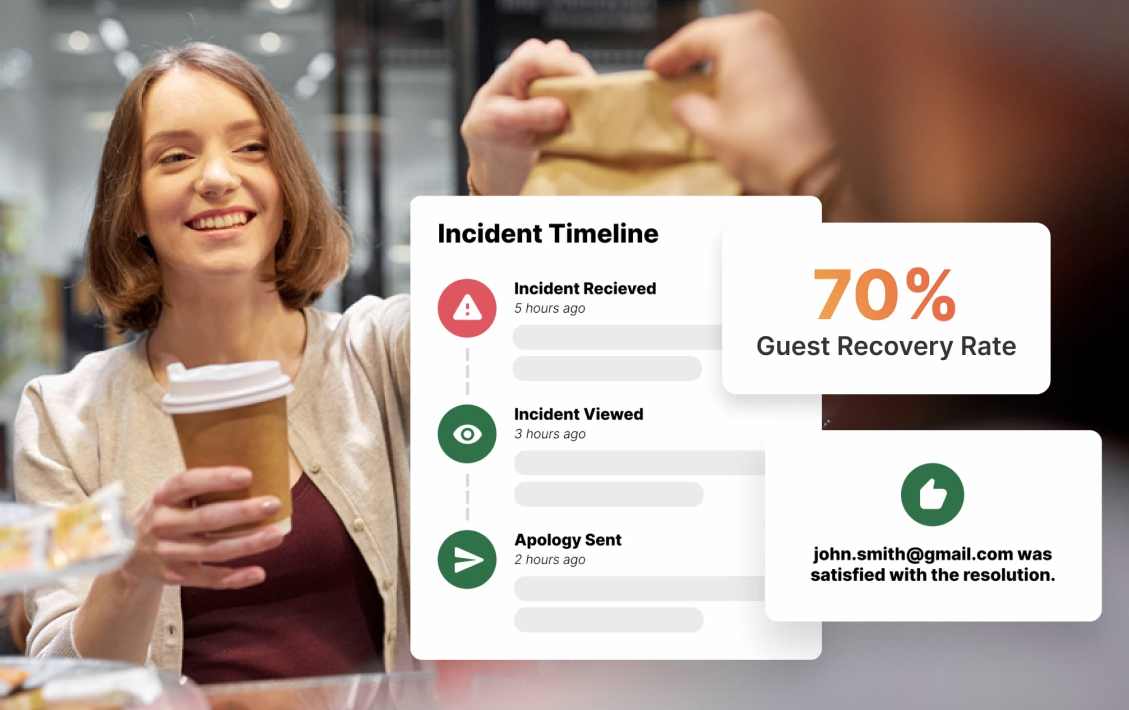
Apart from answering specific questions or spurring-on location-wide customer experience initiatives, Tattle can take action automatically. For example, when a low Customer Experience Rating (CER) is detected in survey responses, Tattle jumps into guest recovery mode. This effort involves sending anything from an apology email to a freebie offer, all of which is completely customizable in the dashboard.
Because of the (https://get.tattleapp.com/integrations/) with top POS, ordering, kiosk, and loyalty providers (e.g. Olo, Punchh, Toast, etc.), data aggregation and automation is far easier to come by.
The old way of NPS is dying out – just ask Chili’s, Hooters, MOD Pizza, Dave’s Hot Chicken, and 200 other restaurant brands. They’ve migrated to the next generation of restaurant technology in Tattle, choosing data-informed decisions and concrete direction over an overly-broad metric.