Insights & Updates
Latest from Tattle
Discover trends, tips, and insights to elevate your restaurant operations.
Discover trends, tips, and insights to elevate your restaurant operations.


What are the menu items that ultimately drive the best customer experiences?
When this question is answered, restaurant brands will have a much clearer picture on what items can power repeat visits and increase revenue.
However, the answer doesn’t revolve around sales metrics — which are typically short-term, superficial, and ambiguous — but through a combination of critical guest experience markers.
That’s where the all-important Affinity Score comes in.
But, before we jump into the Affinity Score, let’s look at what we need to attain this metric in the first place: data surrounding the individual items’ impact on the entire guest experience.
Why does an individual item’s impact on the overall experience even matter?
Allow us to demonstrate.
Let’s say you receive a large swath of guest feedback, which contains an overall experience rating from one to five stars. You want to zoom in onto the happiest and angriest customers — what do they have in common? More specifically, which menu items tend to contribute to either their satisfaction or dissatisfaction?
In turn, you start to compile the following data points:
From those data points, you can put together a scatterplot like the one below (if you’re a pizza brand, for example):
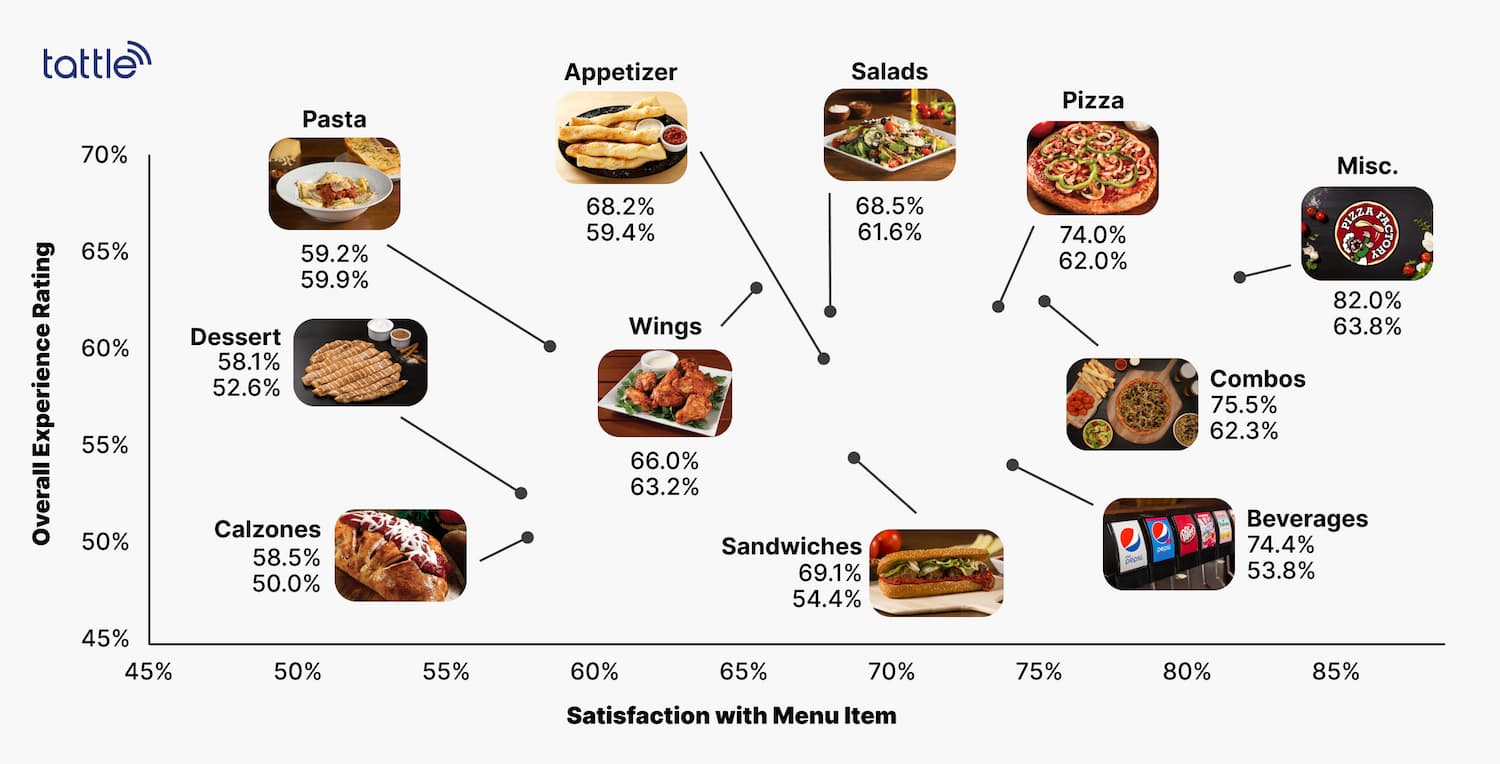
The menu items on the top right hand corner of the graph are performing the best. In the above example, pizzas and combos tend to drive a highly satisfactory experience, while also scoring well as an individual item.
However, if you look at the bottom left corner of the graph, you’ll notice that guests who attach calzones or desserts to their order tend to have a less satisfactory experience, and they tend to rate those menu items lower as well.
By looking at this graph, restaurant marketers and operators can confidently say that when guests order pizzas or combos, they’re more likely to experience higher satisfaction and therefore are more likely to return or recommend your restaurants.
Now we’re ready to get our Affinity Scores.
Affinity Scores are a clever way to simplify the scatterplot we made above.
All you need are the same two data points as we previously mentioned:
It’s worth noting that these two metrics are actually proxies of:
Affinity Score is therefore the summation of the two metrics:
Affinity Score = probability menu item (or category) is 5-star + likelihood to recommend when item is attached to the ticket
You can then rank the Affinity Score of all your menu items or categories like this:
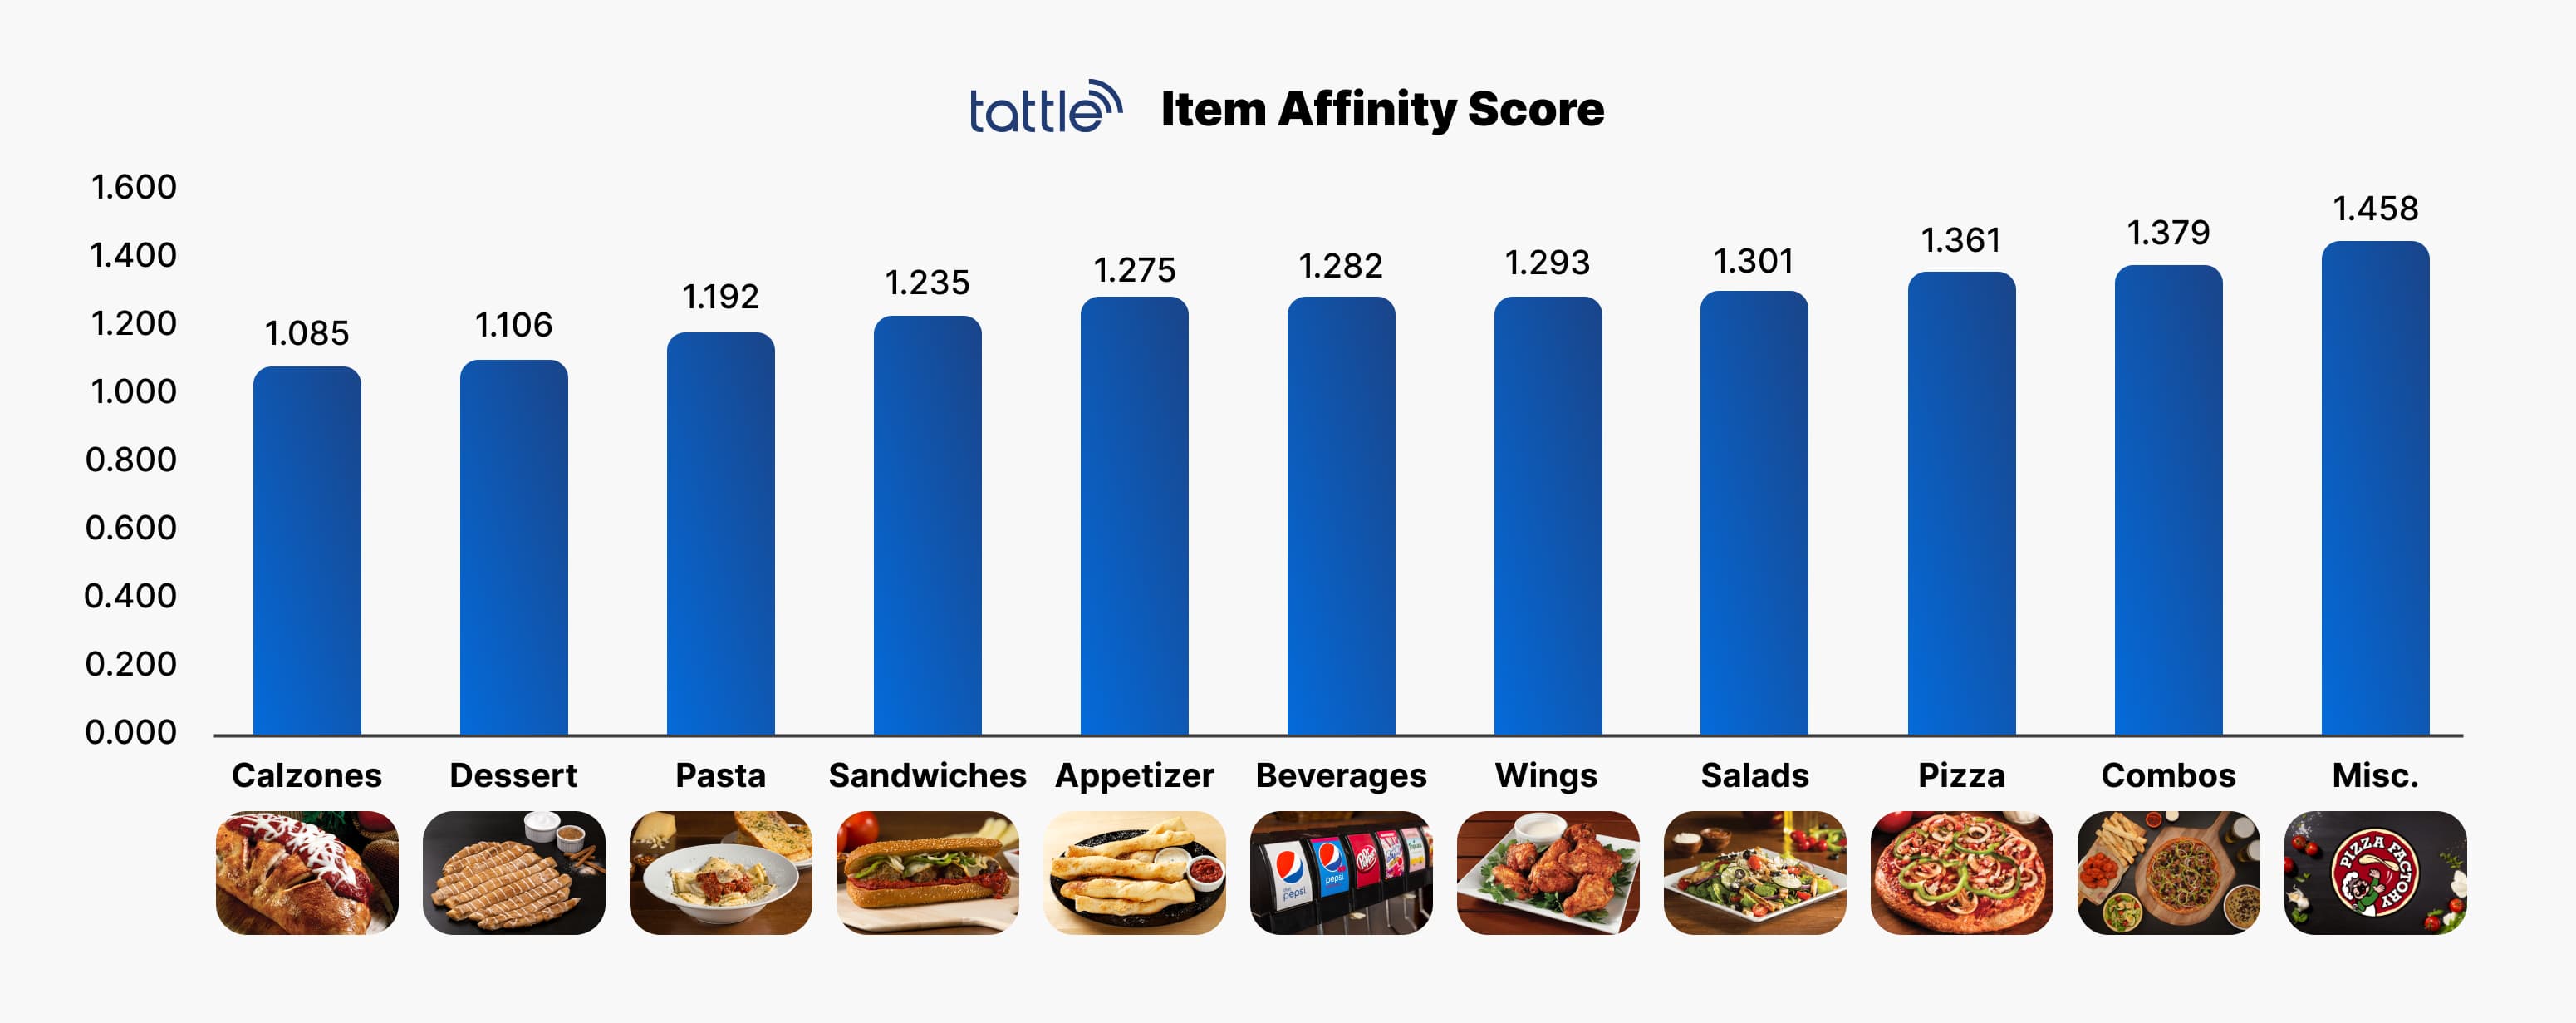
Now you have a clear visualization for the performance of your menu items. The closer to 2, the better the item or category.
Ultimately, Affinity Scores succinctly show which items are more likely to be seen more favorably by guests and drive a better experience.
Referring back to the bar chart above, you should primarily zoom in on items or categories with the highest Affinity Scores and those with the lowest.
Congrats! These are your top performers that you can feel confident promoting. When guests attach these items to their order, they’re more likely to be both satisfied with the execution of these items as well as their overall experience.
Some common ways to drive more traffic to these items could be limited-time promotion, marketing campaigns, featuring them in prominent places on the menu, making up combos that include those items/categories, and more.
In fact, some brands opt to give away these high Affinity Score items for free in an effort to boost satisfaction. For example, after Blaze Pizza discovered that their signature cookies had extremely high Affinity Scores, they gave out leftover signature cookies for free to both boost overall guest satisfaction and reduce food waste.
Closely examine how these items are executed across all your locations before promoting them to your guests. Start with a deep dive into each operational step: sourcing, food prep, storage, and packaging. See if there’s a gap in the SOP or its compliance.
You can engage a franchisee consultant in this process or conduct a thorough internal audit at the most problematic locations. Once you identify and close the operational gap, continue observing those items’ Affinity Scores.
Only start investing marketing dollars behind these items when they have a sufficiently high Affinity Score — this is to make sure that these items aren’t driving your guests away due to a less-than-satisfactory experience.
After all, in this competitive industry, it’s far more difficult to regain a customer than to keep someone coming back.
Sometimes, items with low Affinity Scores might be your brand-differentiating products. These are bespoke to the brand and represent your brand identity. They might not have a high satisfaction rating on the items themselves, but still lead to a high “likelihood to recommend” due to their uniqueness.
In this case, analyze the item’s performance with some other metrics including new transactions (as a result of attaching this item for the first time), ROAS (return on ad spend), take rate (ticket attachment rate) and more to understand your guests’ engagement with the item.
For larger brands with a bigger consumer insights budget, focus groups might also be involved to obtain quantitative insights into how people perceive these brand specific items. Therefore, Affinity Scores are by no means the be-all-end-all metric, and need to be used in context.
Rather than using a more comprehensive metric like Affinity Scores, restaurants tend to focus on sales numbers, percentage sales growth, sales composition, and other similar metrics.
This is a common, yet near-sighted way to look at menu performance, as products that don’t yield the best experience can cause next year’s sales to suffer. Brands that blindly promote best-sellers without looking at other satisfaction metrics will likely fail to drive repeat traffic and ongoing revenue.
At Tattle, we develop a series of essential, yet overlooked metrics that give restaurant leaders, operators and marketers a complete view on their menu performance, operational excellence, and brand experience. You can learn more about our CX platform and white-glove data service for multi-location restaurant brands by getting in touch with our team.
About the Author
Intelligence & Analytics Expert
Alex formerly led Customer Excellence programs at Blaze Pizza and Dunkin'. Now, he oversees LTO testing, operational analysis, and ROI optimization for Tattle partners.